


Executive Summary
Africa’s industrialization has stalled because the capital formation mechanism assumed by standard development models never materialized. Educated workers exist. Entrepreneurial capacity exists. The formal sector jobs that convert education into savings do not.
Charlie Robertson’s industrialization framework—literacy rises, fertility drops, household savings accumulate, banks channel capital into factories, wage employment expands—works when jobs exist to absorb educated workers at wages high enough to generate investable surplus. South Korea, Vietnam, and Bangladesh validated this sequence. But Africa arrived late to global manufacturing, and the structural conditions that made the model work have shifted.
Nigeria’s literacy climbed from 51% to 62% over two decades. Per capita GDP growth averaged under 1% annually. Ghana’s literacy rose from 58% to 79%. Youth unemployment remains above 12%, underemployment exceeds 40%. Education delivered what it promised: literate workers. The downstream jobs never materialized at scale to convert that literacy into household savings.
Three constraints broke the loop: automation compressed manufacturing employment (factories that once needed 1,000 workers now need 200), supply chains consolidated in China and Southeast Asia (breaking in now requires 15-20 year capital cycles African economies can’t finance competitively), and infrastructure deficits raise per-unit costs 20-40% above Asian comparables even with lower wages.
But while waiting for factories, Africa has been generating a different class of tradable output: knowledge assets. Music catalogues now generate $60M+ annually in global streaming revenue. Nollywood produces 2,500 films yearly with expanding platform distribution. BPO and digital services exports exceed $1.4B annually. AI training data, localization services, and software development add $300-500M more. Combined, knowledge economy exports approach $1-1.5B annually—small relative to total trade, but growing 25-40% yearly and requiring 1/100th the upfront capital of manufacturing.
The strategic opportunity: use knowledge economy cashflows to generate the patient capital pools that Robertson’s model assumes must exist before industrialization begins. Those pools can’t form when wage employment doesn’t materialize. Knowledge exports can create them faster.
This requires financial architecture that captures knowledge export revenue (currently 40-60% leaks offshore to foreign intermediaries), pools it at institutional scale, and recycles it into patient capital. Four models provide that infrastructure: royalty securitization (converting future cashflows into upfront capital via bond issuance), IP-backed lending (loans collateralized by IP revenue streams), Africa-IP acquisition funds (private equity purchasing and professionalizing African IP), and creator holding company structures (enabling asset accumulation and intergenerational transfer).
If African policymakers allocated even 10% of SEZ budgets toward knowledge economy infrastructure—IP registries, licensing platforms, royalty collection rails, valuation capacity—the continent could mobilize $650M in new patient capital within five years. That capital then finances industrial projects, infrastructure development, and human capital formation with better terms than traditional FDI.
Africa still needs factories. But the capital to build them can come from monetizing what already works: music catalogues, digital services, creative IP generating dollar revenue today.
I. The Capital Formation Bottleneck
Robertson’s industrialization model remains the most empirically validated development framework we have. Literacy enables workforce productivity. Lower fertility increases household savings rates. Banks intermediate those savings into productive investment. Wage employment expands. The cycle compounds.
It worked across East Asia, Southeast Asia, and parts of Latin America because a critical dependency held: formal sector employment absorbed educated workers at wages sufficient to generate household surplus.
In Africa, that dependency is failing.
Nigeria’s literacy rate stands at approximately 62%, up from 51% in 2000. Yet GDP per capita growth has averaged under 1% annually over the same period. Ghana’s literacy climbed from 58% to 79% between 2000 and 2021. Real wage growth for urban workers has been effectively flat when adjusted for inflation. Kenya’s literacy reached 82%. Youth unemployment remains structurally high despite educational expansion.
The pattern repeats across the continent. Rising literacy without corresponding income growth points to a specific breakdown: the formal sector jobs never materialized at scale.
Why?
First constraint: Automation compression. Manufacturing jobs that once required 1,000 workers now require 200-300, with higher skill floors. Garment production—the classic entry point for industrializing economies—has seen productivity per worker increase 40-60% since 2000 through automation and process optimization. The employment multiplier that powered Asia’s rise has shrunk.
Second constraint: Supply chain consolidation. China, Vietnam, and Bangladesh absorbed the labor-intensive segments of global manufacturing between 1990 and 2015. Breaking into these supply chains now requires competing on infrastructure, logistics, and scale—not just labor costs. African manufacturers face power costs 2-3x higher than Asian comparables, logistics delays that add 15-25% to delivered costs, and financing at 28-35% when competitors access capital at 5-8%.
Third constraint: The capital requirement. Building competitive manufacturing capacity requires 15-20 year investment horizons. A mid-sized garment factory requires $80-120M in capex (land, buildings, machinery, working capital). At Nigerian lending rates of 28-35%, debt service alone consumes potential margins before operational risk is factored in. Foreign direct investment flows toward extractive sectors or services, not manufacturing.
The result: literacy is rising, but the formal sector jobs that convert education into household savings aren’t materializing fast enough.
Simple household arithmetic illustrates the bind:
Urban household income: $200-400/month (median across major cities)
Rent: 35-40% = $70-160
Food: 25-30% = $50-120
Transport: 12-15% = $24-60
Discretionary/savings potential: $56-60/month
To generate pools of capital large enough for industrial lending, African households need to save consistently at levels that current wage structures make nearly impossible. A $50M industrial project requires aggregating savings from 15,000-20,000 households over 5-7 years—assuming zero consumption shocks, stable employment, and functional banking intermediation.
This is the capital formation bottleneck. Manufacturing requires patient capital. Patient capital requires household savings. Household savings require wage employment. Wage employment requires factories already built.
Robertson’s logic holds when jobs exist to convert education into savings. But Africa can’t wait 15-20 years for that loop to close while manufacturing windows narrow and automation accelerates.
The question therefore becomes: Is there a different cashflow source that can generate investable capital faster than waiting for manufacturing employment to produce household savings?
II. Knowledge Asset Economics: The Numbers That Matter
While Africa has been waiting for factories, it has been producing a different class of tradable output: knowledge assets.
These aren’t abstract concepts. They’re revenue-generating exports with verifiable cashflows, global demand, and capital requirements 100-500x lower than manufacturing.
Music intellectual property. African artists now generate approximately $60M annually in global streaming revenue (net artist share after platform fees and label/publisher participation). This includes Afrobeats catalogues with proven commercial traction on Spotify, Apple Music, YouTube, and emerging platforms. Burna Boy’s catalogue alone generates estimated $8-12M annually. Wizkid, Tems, Davido, and dozens of mid-tier artists collectively drive the remainder.
Production costs for commercially viable releases: $5-15k per project (recording, mixing, mastering). Marketing and promotion costs (music videos, playlist pitching, digital campaigns, touring): $40-80k for serious breakthrough attempts. Total artist development capex: $50-100k per artist for professional commercial push.
Compare this to manufacturing:
Manufacturing baseline (garment factory):
Capex: $80-120M (land, buildings, machinery, working capital)
Employment: 1,500-2,000 workers at $180-220/month average
Annual wage bill: $3.2-5.3M
Gross exports: $35-50M/year (depending on capacity utilization)
EBITDA margin: 12-18% = $4.2-9M
Payback period: 12-15 years at 28-35% cost of capital
FX exposure: Negative 50-60% (imported inputs, machinery debt service in dollars)
Failure modes: Power outages, logistics delays, demand shocks, currency crises, labor disputes
Knowledge asset baseline (music catalogue portfolio):
Capex: $600k (10 artists, mixed investment levels)
Employment: 35-50 people (artists, producers, managers, marketing teams)
Revenue outcome (Year 4-5 steady state): $235k annually
1 breakthrough artist: $150k/year
1 mid-tier catalogue: $40k/year
3 moderate performers: $15k each = $45k
5 non-commercial: minimal
EBITDA margin: 60-70% (low overhead once produced)
Payback period: 5-7 years
FX exposure: Positive 90%+ (revenue dollar-denominated, costs naira-denominated)
Failure modes: Catalogue doesn’t achieve commercial traction, platform algorithm changes, artist management conflicts
Per-dollar capital efficiency comparison:
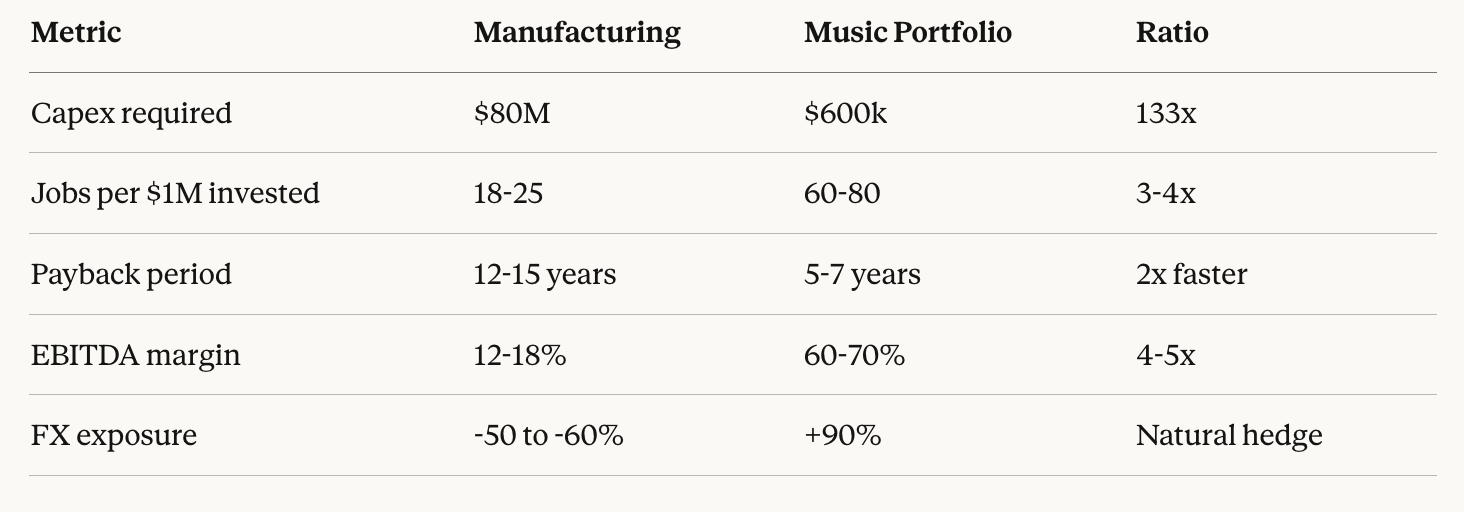
The absolute revenue scale differs dramatically—a single factory generates more total output than a single catalogue portfolio. But the capital efficiency and risk-adjusted returns tell a different story. For every dollar deployed, knowledge assets generate faster payback, higher margins, positive FX exposure, and employment creation at comparable or better rates per unit of capital.
This pattern extends across knowledge economy sectors:
Film and television production (Nollywood model):
Production capex: $50-200k per feature film
Employment: 30-50 crew per project
Revenue potential: $100-300k lifetime (theatrical, streaming, TV rights)
Payback: 2-4 years
Annual sector exports: $100-150M
BPO and digital services:
Workstation setup: $10-30k (equipment, software, connectivity)
Employment: 1-2 workers per workstation
Revenue per workstation: $25-50k annually
Payback: 1-2 years
Kenya BPO sector alone: ~$1B annual exports
Nigeria tech services estimated: $400-600M
Software development and SaaS:
Developer setup costs: $5-15k (equipment, tools, licenses)
Revenue per developer: $40-80k annually (outsourced contracts, product revenue)
Payback: <1 year in many cases
Estimated African software exports: $300-500M annually
AI training data and localization services:
Data labeler setup: <$5k (device, connectivity, platform access)
Revenue per labeler: $8-15k annually
Payback: <1 year
Estimated current market: $50-100M, growing 40-50% annually
The strategic insight is numeric: knowledge assets generate recurring dollar-denominated cashflows within 24-36 months with capital requirements 100-500x lower than manufacturing. They don’t require 20-year infrastructure build-outs, don’t depend on global supply chain integration, and produce positive FX exposure that creates natural hedges against naira depreciation.
Knowledge exports become the logical first move — the cashflow bridge that generates patient capital pools which can then finance industrial development — with better terms than waiting for household savings to accumulate from jobs that haven’t materialized.
If Nigeria deployed $50M into knowledge economy infrastructure—less than 5% of typical annual SEZ allocations—it could catalyze $200-300M in new export revenue within 3-5 years. That revenue, if captured and recycled properly, generates the savings Robertson’s model assumes must exist before industrialization begins.
The strategic task becomes clearer: generate investable capital from what Africa already produces efficiently, then deploy it toward what still needs building.
But generating this investable capital requires capturing knowledge cashflows. And, as it stands, this is far from the case. In fact, the bulk of these cashflows evaporate before touching the continent.
Why do these cashflows currently dissipate? What is the financial architecture to capture them, and the regulatory infrastructure required to make it work? Continues online.
[Continue reading: Front-Loading Development]
III. Why Knowledge Cashflows Currently Evaporate
Africa generates $1-1.5B in annual knowledge economy exports. Yet this revenue produces minimal domestic capital formation. An estimated 40-60% leaks offshore through foreign intermediaries. The remainder dissipates through consumption rather than reinvestment. Four structural gaps explain the leakage.
Offshore capture through intermediary rent extraction. Most African artists sign distribution deals with foreign labels or publishers who control global licensing relationships. Standard agreements allocate 30-50% of streaming revenue to distributors, another 15-25% to publishers for rights administration. A Nigerian artist earning $100k in Spotify streams receives $35-50k after intermediary fees. The remainder stays with US or UK entities handling playlist pitching, metadata management, and royalty collection—services African infrastructure doesn’t yet provide at competitive quality.
Consumption patterns versus reinvestment discipline. Knowledge workers lack access to financial products designed for lumpy, irregular cashflows. When an artist receives a $50k sync licensing payment, no domestic bank offers structured products that convert windfall income into systematic reinvestment. The payment gets treated as consumption income—used for immediate needs, family support, or lifestyle expenses—rather than deployed into catalogue development, equipment acquisition, or other asset-building activities. This reflects both cultural patterns (extended family obligations, status signaling through consumption) and institutional gaps (absence of IP-backed savings vehicles, catalogue valuation services, or estate planning infrastructure).
Missing securitization and liquidity infrastructure. Mature music markets have secondary trading platforms where catalogues change hands at established multiples. African artists have no equivalent. When liquidity needs arise, they sell catalogues at distressed prices (1-2x annual revenue) because no transparent market exists to establish fair value. No local firms provide IP valuation services using standardized methodologies. No rating agencies assess catalogue creditworthiness for debt instruments. Banks don’t recognize royalty streams as acceptable collateral because legal frameworks for perfecting security interests in intangible assets remain underdeveloped—though Nigeria’s National Collateral Registry accepting IP registrations in 2024 represents progress.
Regulatory and tax friction reducing net proceeds. Cross-border royalty payments face withholding taxes of 15-30% depending on treaty structures. Remittance costs add another 3-7% in fees. Many African creators operate informally, losing access to treaty benefits and unable to claim legitimate business expense deductions. No jurisdictions offer tax incentives comparable to R&D credits or accelerated depreciation that encourage reinvestment in content production. The combined effect: a $100k gross royalty payment becomes $55-65k net after intermediaries, taxes, and remittance costs.
The aggregate result: $1-1.5B in annual knowledge exports generates less than $200-300M in domestic capital formation available for productive reinvestment—an 80-85% leakage rate. This stands in stark contrast to manufacturing, where export revenue (though smaller in absolute terms for knowledge sectors) stays largely domestic through wage payments, supplier networks, and corporate retained earnings.
What’s needed: financial architecture that captures these cashflows at source, pools them to institutional scale, and channels them into patient capital vehicles before consumption or offshore leakage dissipates the value. The following section present four models that provide exactly this infrastructure.
IV. Financial Architecture — Four Models for Capital Mobilization
Knowledge economy cashflows currently evaporate through offshore leakage and consumption. Converting them into patient capital requires four financial mechanisms, each suited to different asset maturity levels, creator sophistication, and capital requirements. Together, they form a complete infrastructure for monetizing African knowledge assets at scale.
Model 1: Royalty Securitization
Concept: Pool 80-100 catalogues into a special purpose vehicle, issue bonds backed by future royalty streams, deploy proceeds as upfront capital.
Mechanics:
Eligibility requires proven revenue history—minimum three years of streaming data, diversified across platforms and geographies. Pool composition example: 15 mid-tier catalogues averaging $40k annual revenue ($600k total), 35 moderate catalogues at $15k each ($525k), 50 emerging catalogues at $5k ($250k). Combined annual cashflow: $1.375M.
Valuation applies discounted cashflow methodology. Project revenue over eight years with 10% annual decline (conservative based on catalogue aging patterns), discount at 17% (Nigerian frontier risk premium over 8-12% US music catalogue rates). Net present value: approximately $5.5M.
Bond issuance follows conservative loan-to-value ratios. At 45% LTV, the SPV raises $2.5M. Coupon must compensate institutional investors for novelty and illiquidity—with Nigerian government bonds yielding 15-18%, IP bonds require 18-22% to attract pension funds. Using 20% rate: annual debt service equals $500k, providing 2.75x coverage ratio against $1.375M revenue.
Payment waterfall operates automatically: streaming platforms route royalties to collection society, society transfers to SPV bank account, SPV services bondholders first, residual flows to equity holders (original catalogue contributors).
Capital deployment: $2.5M upfront splits across three uses—50% ($1.25M) returns to catalogue owners as lump-sum liquidity for reinvestment, 30% ($750k) funds new artist development expanding future revenue base, 20% ($500k) builds licensing infrastructure reducing systemic leakage.
Scaling potential: If 20% of Nigeria’s $60M music export base participates, that’s $12M in annual cashflows. At comparable structure (45% LTV, $5.5M valuation per $1.375M cashflow), approximately 9 pools emerge generating $22-25M in bond issuance annually.
Model 2: IP-Backed Lending
Concept: Banks provide loans collateralized by individual catalogue cashflows, similar to asset-based lending against receivables or inventory.
Mechanics:
A mid-tier artist with $40k annual streaming revenue sustained over three years owns a verifiable asset. Standard African catalogue valuation applies 3-4x annual revenue multiple (conservative relative to 5-10x in developed markets, reflecting platform and enforcement risk). Catalogue values at $120-160k.
Loan structure: $40k principal (25-30% LTV, conservative for novel asset class), 32-35% interest rate (reflecting Central Bank MPR of 27.5% plus novelty premium, but below 38-45% unsecured SME rates because collateral exists), 24-36 month term.
Security mechanism requires irrevocable payment instruction—artist authorizes streaming platforms to route royalties directly to lender account until debt satisfied. Monthly cashflow: $3,300 average revenue, $1,450 debt service at 33% APR, $1,850 net to artist. Coverage ratio: 2.3x, sufficient buffer for revenue volatility.
Recent regulatory progress enables this model. Nigeria’s National Collateral Registry began accepting IP registrations in 2024, allowing lenders to perfect security interests. Several commercial banks are developing IP-backed lending products targeting 2026 launch, establishing valuation protocols and monitoring systems.
Default management: If quarterly revenue drops 30% below baseline, lender triggers review. Persistent decline activates security interest—lender can sell catalogue to recover principal. This requires transparent platform reporting (lender dashboard access) and liquid secondary markets (improving as securitization establishes price discovery).
Currency advantage: Both manufacturing and IP loans face identical 32-35% rates in Nigerian market. The critical difference: catalogue revenue is dollar-denominated while debt remains naira-denominated. As currency depreciates, artist earning power increases in local terms while debt stays fixed—creating natural deleveraging. Manufacturing loans face opposite dynamics (naira revenue, dollar-linked input costs).
Scaling potential: Nigeria has 1,000-2,000 artists with catalogues earning $30k+ annually. If 25% access loans averaging $35k: 250-500 loans totaling $8.75-17.5M in lending volume. Artists deploy proceeds into studio upgrades, marketing campaigns, touring infrastructure, new production. Banks expand lending without additional capital (loans are collateralized).
Model 3: Catalogue Acquisition Funds
Concept: Private equity model purchasing African catalogues at current distressed valuations, professionalizing management, exiting at normalized multiples to generate institutional returns.
Investment thesis: African catalogues trade at systematic discounts. Creators lack sophisticated licensing infrastructure—revenue leaks through incomplete metadata, missing rights registration, untracked platforms. No transparent secondary market exists for price discovery. When artists need liquidity, they sell at 1-2x annual revenue. Properly managed catalogues in developed markets trade at 5-10x.
Fund structure that actually works: Unlike African VC funds importing US/UK models without accounting for local constraints, catalogue funds align structure with asset dynamics. Target raise: $50-100M. Investment period: 3 years. Hold period: 7-10 years. Exit window: Years 6-10.
This timeline fits standard PE models because underlying assets already generate cashflows (eliminating development risk), exit buyers exist globally (major publishers, international funds, streaming platforms acquiring directly), and 7-10 year holds match actual asset maturation rather than fighting against extended development cycles that broke African VC.
Value creation mechanics: Acquire catalogue generating $100k annually for $250k (2.5x multiple reflecting distressed market). Apply operational improvements: metadata cleanup recovers $15k in historical unpaid royalties, sync licensing development adds $20k annually, international expansion increases streaming $10k. New run-rate revenue: $145k (+45%). Hold 7 years. Exit at 5.5x to institutional buyer = $797k. Gross return: 3.2x invested capital. IRR: 23%.
Portfolio construction requires 200-500 catalogues, no single asset exceeding 5% of NAV, diversified across genres and artist career stages. Target fund-level IRR: 22-25%—sufficient to attract Nigerian pension funds ($35B+ AUM), diaspora family offices, and DFIs seeking frontier impact exposure.
Why creators sell: Hit-driven revenue creates lumpy cashflows. Selling mature catalogue provides $200-500k lump sum deployable into new production, touring infrastructure, or debt paydown. Many prefer this to waiting 7-10 years for equivalent cashflows through annual royalties. Catalogue sales also enable intergenerational wealth transfer—$400k properly invested generates $40-60k annually, creating family passive income while artist focuses on new creation.
Catalytic effects beyond returns: Acquisition activity establishes transparent price discovery—when funds pay $500k for catalogues earning $200k, every comparable artist gains valuation benchmark. This raises industry-wide asset values. Fund track records demonstrate IP as investable asset class, attracting more capital and compressing risk premiums. Professionalization captures revenue currently lost to incomplete rights data—estimated 30-50% of African streaming revenue goes uncollected, so better infrastructure expands total pie rather than just redistributing existing value.
Model 4: Creator Holding Company Structures
Concept: Creators incorporate offshore entities that own IP assets, enabling tax optimization, estate planning, collateral aggregation, and professional governance.
Mechanics:
Standard structure uses favorable jurisdictions—Mauritius (7.5% WHT to Nigeria under treaty vs. 30% direct), UK (0% WHT but compliance costs higher), or Singapore (robust legal framework, 5-10% effective rates). Artist assigns catalogue ownership to HoldCo. Streaming revenue flows through optimal routing: US platforms → HoldCo (reduced WHT) → reinvestment or dividend distribution.
Tax arbitrage example: Nigerian artist earning $100k from US platforms pays $30k WHT if receiving directly (30% rate). Routing through Mauritius HoldCo with proper structuring: $7.5k WHT (7.5% treaty rate). Annual savings: $22.5k. HoldCo setup and ongoing compliance costs: $15-25k total first year, $8-12k annually thereafter. Payback: 12-18 months through tax savings alone.
Estate planning benefits: Individual catalogue ownership requires probate, asset-by-asset transfer, potential litigation among heirs. HoldCo ownership means heirs inherit shares—single transfer, no probate complications, corporate continuity maintained. Board can include professional managers ensuring catalogue exploitation continues during family transitions.
Collateral aggregation: Banks more readily lend against corporate borrowers with audited financials than individual artists. HoldCo can borrow against pooled catalogue portfolio, achieving better terms (lower rates, longer tenors) than individual IP-backed loans. Corporate structure also enables equity participation—investors can buy minority stakes in HoldCo, providing growth capital without artist surrendering catalogue ownership.
Operational professionalization: HoldCo establishes formal governance—board oversight, proper accounting, rights management systems, strategic planning. This discipline often increases revenue 15-25% through better exploitation and cost control, independent of tax benefits.
Scaling threshold: Structure becomes economically viable for artists earning $100k+ annually. Below that threshold, setup costs and compliance burden exceed tax savings. Nigeria has approximately 200-300 artists in this range. Ghana, Kenya, South Africa add similar numbers. Regional adoption could optimize $30-50M in annual artist earnings, generating $5-10M in tax savings redeployable into production and infrastructure.
Comparative Framework: When to Use Each Model
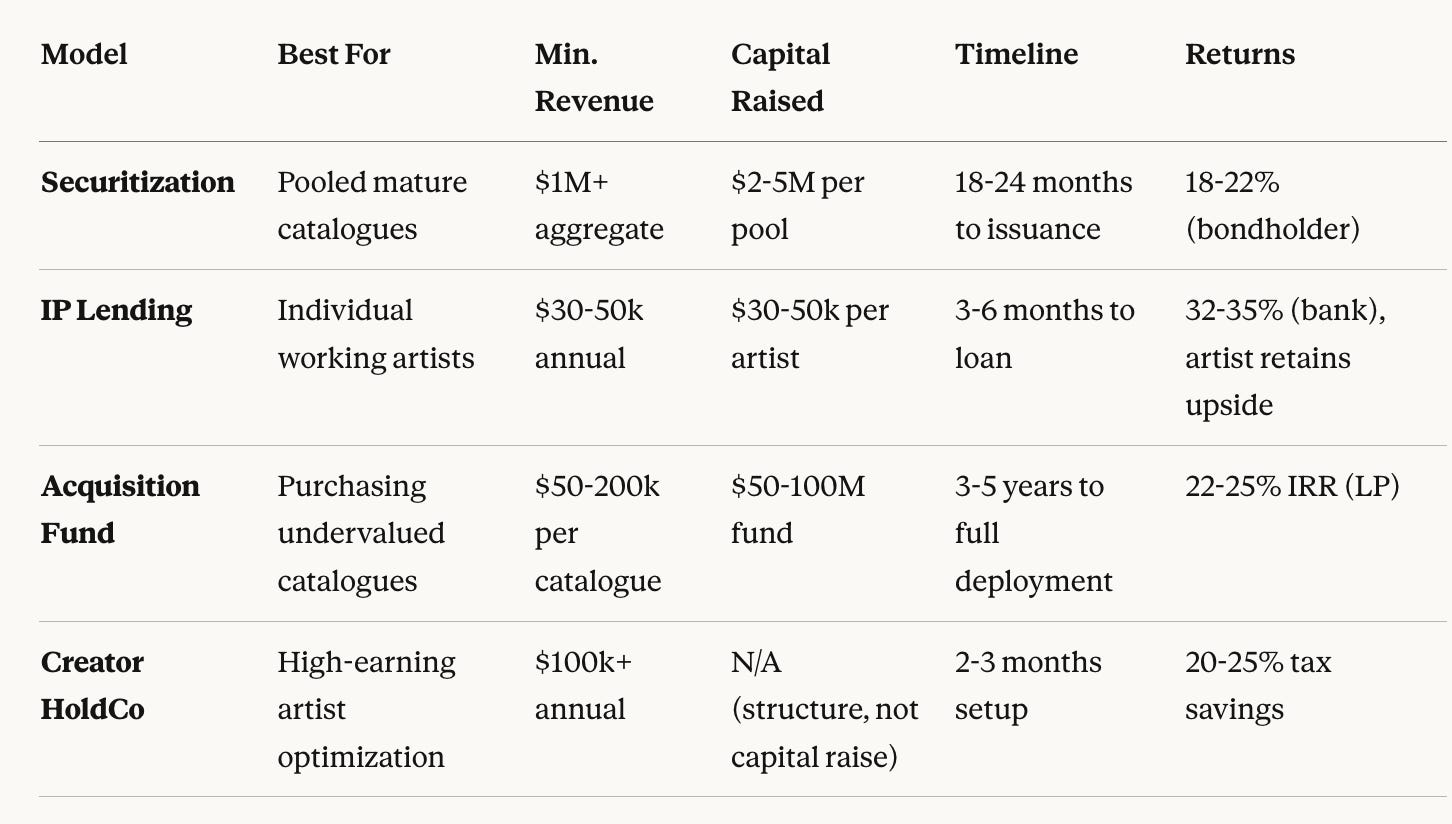
Selection logic: Early-stage artists ($30-50k) use IP lending for working capital. Mid-tier artists ($50-100k) consider selling catalogues to acquisition funds for liquidity. High earners ($100k+) implement HoldCo structures for tax efficiency. Mature catalogue pools ($1M+ aggregate) access bond markets for institutional capital.
Combined Capital Mobilization Potential
Year 1 conservative projection:
Securitization: 1 pilot pool → $2.5M
IP Lending: 100 loans @ $35k average → $3.5M
Acquisition Funds: First fund closes → $50M committed
Creator HoldCos: 50 implementations saving $5M in taxes → $5M retained domestically
Total Year 1: $61M in new patient capital mobilized
Year 3 scaling:
Securitization: 4-5 pools → $10-12M
IP Lending: 500 loans → $17.5M
Acquisition Funds: 2 funds, $150M AUM → capital working
Creator HoldCos: 200 structures → $15M tax savings retained
Total Year 3: $192.5M+ annual capital mobilization
Year 5 mature market:
Securitization: 10-12 pools → $25-30M annually
IP Lending: Standard bank product, 1,000 loans → $35M
Acquisition Funds: $300M AUM actively deploying
Creator HoldCos: 500+ implementations → $30M retained
Total Year 5: $390M+ in sustained annual capital formation
This capital didn’t require waiting 15-20 years for manufacturing employment to generate household savings. It monetized knowledge assets already producing revenue, using financial architecture that captures, pools, and recycles cashflows into patient capital available for industrial projects, infrastructure development, and human capital formation.
The four models work together as ecosystem—IP lending provides working capital for active creators, HoldCos optimize tax efficiency for successful artists, acquisition funds create liquidity and price discovery, securitization channels mature catalogues into institutional capital markets. Each reinforces the others, building the financial infrastructure that converts Africa’s knowledge economy from revenue source into capital formation engine.
V. Implementation Roadmap: Building the Infrastructure
Knowledge economy financial architecture requires coordination across legal, regulatory, financial, and technical systems. Implementation follows three parallel tracks, each with distinct timelines and dependencies.
Track 1: Legal and Regulatory Infrastructure (18-24 months)
Nigeria’s National Collateral Registry began accepting IP registrations in 2024, establishing legal foundation for lenders to perfect security interests in intangible assets. This addresses the primary enforcement concern—ensuring creditors have priority claim to catalogue cashflows in bankruptcy or default scenarios.
Parallel development needed: securities law amendments recognizing royalty-backed bonds as eligible instruments. The SEC already regulates asset-backed securities for receivables and lease payments. Extending this framework to IP cashflows requires technical guidance on valuation standards, disclosure requirements for SPV issuers, and investor suitability criteria. Timeline: 12-18 months for rule drafting, stakeholder consultation, and final regulations.
Tax framework optimization. Current withholding tax on cross-border royalties (typically 15-20%) reduces net cashflows available for debt service in securitization structures. Relief mechanisms exist for treaty-eligible jurisdictions, but process is cumbersome. Streamlined application procedures and potential reduction to 5-10% for IP export revenue would improve economics materially. Precedent: South Africa’s 5% WHT rate for qualifying royalties.
Regional harmonization through ECOWAS or East African Community creates economies of scale. An artist’s catalogue registered in Nigeria should be automatically enforceable in Ghana, Kenya, and South Africa without duplicative legal processes. This mirrors EU frameworks where security interests perfect across member states. Timeline: 24-36 months for treaty negotiation and implementation.
Track 2: Financial Infrastructure (12-24 months)
Platform payment integration represents the critical technical bottleneck. Streaming services must enable direct payment routing based on verified security interests. Current systems route payments to artists’ designated accounts (typically DistroKid, TuneCore, or direct bank accounts). Adding lender instructions requires platform cooperation—technically trivial (payment systems already handle complex routing) but operationally significant (requires compliance review, legal framework validation, counterparty risk assessment).
Platform integration requires early negotiation with Spotify, Apple Music, and YouTube on compliance protocols and payment routing infrastructure. Kenya’s M-Pesa provides precedent—platforms integrated mobile money disbursements because regulatory clarity existed and commercial incentives aligned (faster settlement, lower remittance costs). IP-backed lending offers similar value proposition: platforms reduce payment complexity by routing to single institutional account rather than thousands of individual artists.
Valuation capacity development. Several Nigerian commercial banks are piloting IP-backed lending products for 2026 launch. Success requires standardized valuation methodologies—either internal capacity (training credit analysts in DCF modeling for IP assets) or reliance on third-party appraisers. International frameworks exist: the Royal Institution of Chartered Surveyors (RICS) publishes IP valuation standards; the International Valuation Standards Council (IVSC) provides technical guidance. Training 15-20 local professionals through partnership programs establishes sufficient capacity for initial market development. Timeline: 12-18 months.
Capital market product launches. First royalty-backed bond issuance should target $10-25M scale—large enough to establish proof of concept, small enough to minimize risk if structural issues emerge. Ideal issuer: established music publisher or aggregator with diversified catalogue portfolio and 5+ years of revenue history. Credit enhancement through DFI first-loss participation (AfDB or IFC provides subordinated tranche covering first 15-20% of losses) improves credit rating and investor appeal. Timeline: 18-24 months from structure design to market launch.
Track 3: Ecosystem Development (24-36 months)
Creator financial literacy programs shift industry mindset from transactional income to asset accumulation. Most artists treat royalty payments as consumption income, not investable capital. Education initiatives should cover: IP ownership structures, licensing mechanics, catalogue valuation fundamentals, tax optimization through holding company incorporation, and estate planning for intergenerational transfer.
Delivery mechanisms: partnerships with music industry associations (PMAN in Nigeria, MCSK in Kenya), curriculum development for creative arts programs at universities, and workshop series in major markets. Target: 2,000-3,000 creators trained in first 24 months, establishing baseline financial literacy that improves bankability.
Institutional investor education runs parallel track. Pension fund trustees and insurance company investment committees need exposure to IP asset risk-return profiles. Roadshow format: present case studies from Hipgnosis Songs Fund (UK) and Round Hill Music Royalty Fund (US), demonstrate historical cashflow stability from mature catalogues, model downside scenarios and loss severities, and structure co-investment opportunities with DFI first-loss tranches reducing risk for first-time participants.
Success metric: commitments from 3-5 institutional investors totaling $50-100M within first 18 months. This capital underwrites initial bond issuances and seed catalogue acquisition funds.
Policy advocacy for tax incentives. Software R&D already receives favorable tax treatment in many jurisdictions (Nigeria’s Pioneer Status Incentive, Kenya’s EPZ benefits). Extending similar treatment to content creation—deductions for production costs, accelerated depreciation for catalogue assets, exemptions from certain transaction taxes—improves after-tax returns and signals government prioritization of knowledge economy development.
Sequencing and interdependencies:
Year 1 priorities: Legal framework finalization (collateral registry integration complete, securities law amendments drafted), platform payment pilots (negotiations with Spotify/Apple), valuation capacity development (train first cohort of appraisers), creator education launch.
Year 2 execution: First IP-backed loans issued by pilot banks (target $5-10M volume), first royalty-backed bond issuance ($10-25M), first catalogue acquisition fund closes ($30-50M), institutional investor commitments secured.
Year 3 scaling: IP-backed lending becomes standard bank product (5-10 banks offering, $40-80M volume), multiple bond issuances totaling $60-100M, second-generation acquisition funds ($80-150M), regional expansion to Ghana/Kenya/South Africa.
Capital mobilization projection:
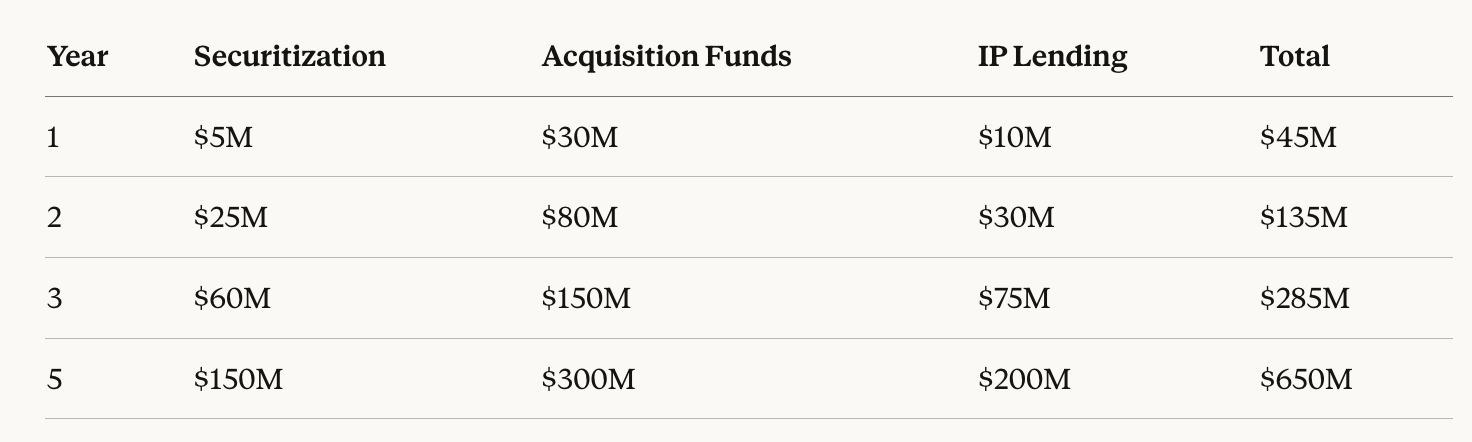
By Year 5, $650M in patient capital mobilized from knowledge economy cashflows—equivalent to financing 350-450 mid-sized industrial projects or 18-25 large-scale manufacturing facilities, without waiting for household savings to accumulate through wage employment that hasn’t materialized.
VI. The Strategic Resequencing
Robertson’s industrialization framework remains the most empirically validated development model available. Literacy enables productivity. Lower fertility increases household savings rates. Banks intermediate savings into productive investment. Industrial employment expands. The cycle compounds.
The model works when jobs exist to absorb educated workers at wages sufficient to generate household surplus.
Africa’s constraint is not lack of literacy or entrepreneurial capacity. The constraint is absence of patient capital because wage employment never materialized at scale to generate household savings that banks could intermediate into industrial investment.
Knowledge exports solve this by generating dollar-denominated recurring cashflows without requiring completed industrialization first. Music catalogues, film libraries, software products, digital services, and AI training data generate $1-1.5B in annual exports today with growth rates of 25-40% exceeding traditional sectors.
These cashflows currently evaporate. An estimated 40-60% leaks offshore through foreign intermediaries. Artists and creators consume windfall payments rather than reinvesting. No financial architecture exists to capture, pool, and recycle this revenue into patient capital.
The four models presented—royalty securitization, IP-backed lending, catalogue acquisition funds, and creator holding companies—provide that architecture. They convert consumption income into investable capital. They aggregate individual cashflows into institutional scale. They generate returns sufficient to attract pension funds and development finance institutions while preserving creator participation through equity residuals and licensing revenues.
Implementation requires coordinated action across regulatory bodies, commercial banks, streaming platforms, and industry associations. Nigeria’s National Collateral Registry accepting IP registrations represents foundational progress. Commercial banks developing IP-backed lending products for 2026 launch demonstrates market demand. What remains is building valuation capacity, establishing platform payment integration, launching first bond issuances, and seeding acquisition funds with institutional capital.
If African policymakers allocated 10% of typical SEZ budgets toward knowledge economy infrastructure—legal framework development, valuation capacity building, platform integration, creator education—the continent could mobilize $650M in new patient capital within five years. This capital flows into industrial projects with better financing terms than traditional FDI, infrastructure development that reduces costs across all sectors, and human capital formation that increases productivity economy-wide.
This is not choosing between exports and manufacturing. Africa needs both. But today’s comparative advantage lies in creative and digital production. And tomorrow’s manufacturing gets financed by today’s knowledge-asset revenue if we build the right rails.
The strategic question is whether we monetize these assets efficiently and use proceeds to build patient capital pools—or continue waiting for a manufacturing employment surge that global economic dynamics make increasingly unlikely to materialize at the scale and speed required for household savings to accumulate sufficiently for industrial finance.
Knowledge economy cashflows can front-load the capital formation process. Securitization, IP-backed lending, and acquisition funds convert future revenue streams into present capital. That capital then finances the infrastructure, industrial capacity, and human development that Robertson’s model identifies as necessary for sustained growth.
The sequencing changes. The destination remains the same. Africa still needs manufacturing capacity, infrastructure investment, and formal employment creation. But instead of waiting 15-20 years for the Robertson loop to complete itself organically, knowledge economy financial architecture accelerates the process by generating investable capital from assets already producing revenue.
This requires discipline. Legal frameworks must be enforceable. Valuation standards must be rigorous. Capital must flow to productive deployment rather than consumption. Institutions must build capacity to underwrite novel asset classes. But the economic logic is sound, the technical precedents exist in developed markets, and early movers gain competitive advantages in underserved segments.
Industrial development remains essential. What changes is that instead of waiting decades for wage employment to generate savings, we monetize existing knowledge assets and use those proceeds to accelerate infrastructure and factory construction. The path matters as much as the destination.