
THE LIQUIDITY MIRAGE: WHY $500M AFRICAN FUNDS CAN’T DEPLOY LIKE $50M ONES
How deal scarcity, governance bandwidth, and exit liquidity create inverse scale economics in African VC—and why bigger isn’t better

In Silicon Valley, $500M funds deploy faster than $50M funds. In African venture capital, the opposite holds true.
The pattern has become unmistakable. Multiple African VC mega-funds raised between 2021 and 2022—experienced teams, global LP backing, pan-African mandates—are tracking toward 40-60% deployment four years into their investment periods. Meanwhile, $75-100M funds from the same vintage are approaching full deployment.
This is not operator failure. This is structural impossibility.
The African VC industry imported Silicon Valley fund sizing logic without accounting for fundamental market structure differences. The result is systematic capital misallocation that hurts LPs, constrains GPs, and distorts ecosystem pricing. Mega-funds are not sophisticated evolution. They represent structural mismatch.
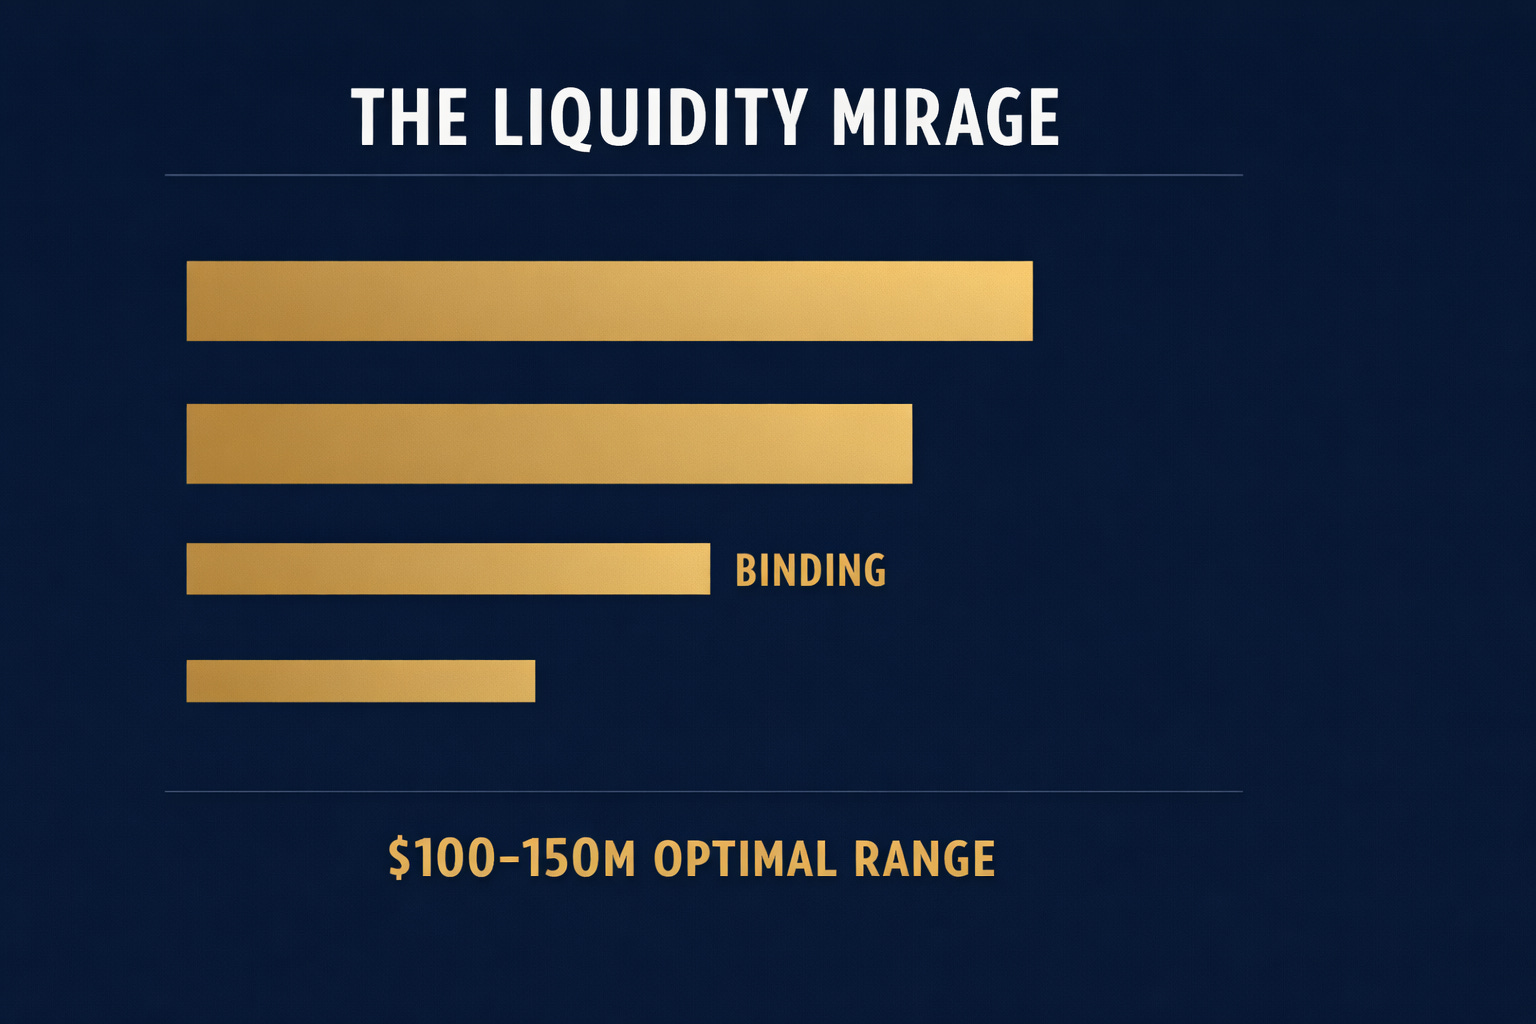
African VC operates under inverse scale economics. Funds demonstrate optimal deployment efficiency between $75M and $150M. Performance degrades progressively as fund size increases beyond this range. Above $250M, binding constraints create systematic underperformance. The question is not whether this dynamic exists—observable data confirms it does. The question is whether LPs and GPs will acknowledge it and optimize fund sizing accordingly.
WHY THIS MATTERS NOW
Misaligned fund sizing cascades through the entire ecosystem, creating systematic failures at every level.
LPs commit capital to $300M Africa funds expecting 3.5-4x net MOIC. That capital sits in slow-deploying vehicles, extending return timelines and destroying time-value of money. The same $50M allocation could have gone to a right-sized fund actually putting capital to work. Opportunity cost compounds with every year of deployment delay.
Mega-funds forced to deploy larger checks pay higher valuations to justify ticket sizes. They need bigger exits to generate returns, but African exit markets have not scaled proportionally to fund sizes. The result is that LPs receive lower returns than appropriately-sized funds would have delivered.
GPs face impossible mathematics. LPs expect $300M deployed over four years—that translates to $75M annually. African deal reality delivers perhaps 8-12 viable Series B and later-stage opportunities annually across target markets. This dynamic forces GPs to stretch into suboptimal deals, overpay on valuations to justify larger checks, or miss deployment targets. None of these options produces strong returns.
The reputational damage compounds over time. An experienced GP raises a mega-fund, cannot deploy effectively, and appears incompetent to the market. Observers read this as execution failure when the underlying cause is structural impossibility baked into the fund size itself.
Founders face distorted capital offers. A mega-fund needs $15-25M checks to make portfolio mathematics work. The company actually justifies an $8M round at disciplined valuation multiples. The mega-fund offers $18M at an inflated price. The founder accepts it. The company now carries the wrong cap table, unsustainable burn rate, and unrealistic expectations for subsequent financing rounds. The mispricing cascades forward through the entire lifecycle.
The ecosystem experiences pricing contagion. When a mega-fund overpays for a Series B round, it establishes inflated comparables for other Series B transactions. Smaller funds find themselves forced to either match inflated pricing or lose access to deals. Market-wide valuation inflation disconnects from underlying fundamentals. When these companies eventually need exits, they carry price tags implying $200-500M acquisitions in a market where most exits occur between $30M and $150M.
THE DEPLOYABLE CAPITAL CEILING
African VC fund size faces constraints from four binding factors. Together these factors create optimal deployment efficiency around $100-150M, with performance degradation beyond this range and systematic failure above $250M.
Constraint 1: Deal Scarcity
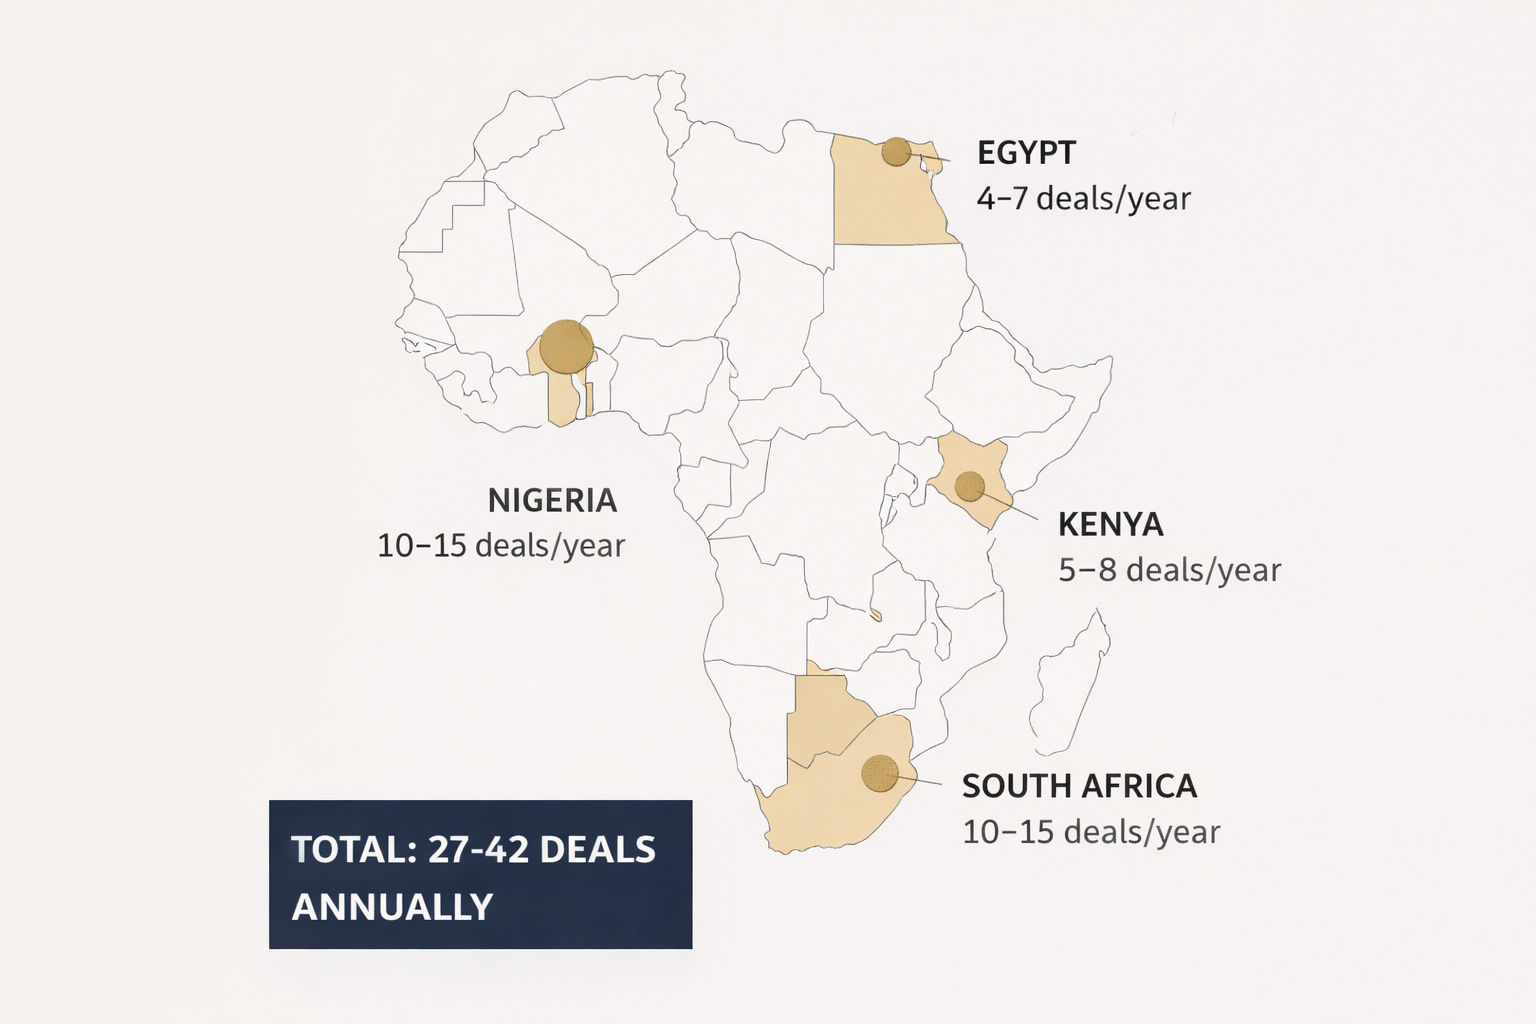
The mathematics begin with counting viable opportunities. Nigeria produces an estimated 10-15 companies annually that reach genuine Series B scale—above $5M in annual recurring revenue or equivalent business metrics with viable paths to profitability—based on observable funding patterns. Kenya delivers 5-8 such companies. South Africa produces 10-15. Egypt contributes 4-7.
The total addressable opportunity across the Big Four markets ranges from 27-42 Series B and later-stage deals annually.
A $300M fund with deployable capital of $270M after fees needs approximately 20 portfolio companies for adequate diversification. Deploying over four years requires five new deals per year. This appears feasible against 27-42 annual opportunities—until market realities intervene.
Not all opportunities fit any single fund’s thesis. Sector focus, stage preferences, geographic constraints, and competitive dynamics eliminate 50-60% of the theoretical deal universe. The addressable opportunity for any specific fund shrinks to 12-20 deals per year, not 27-42.
Competition intensifies scarcity. Multiple mega-funds chase the same limited deal flow simultaneously. A fund’s realistic deployment opportunity contracts to 3-5 attractive deals annually.
The mathematics break down under these conditions. A fund needs five deals per year but can access only 3-4 that genuinely fit the strategy. Deployment stretches to 6-8 years instead of the planned four years. Every year of deployment delay destroys LP returns through time-value erosion.
Constraint 2: Deployment Rate Requirements
The constraint operates differently than simple ticket size mismatch. When we account for proper fund mechanics, a more subtle problem emerges.
A $300M fund generates $270M in deployable capital after management fees, assuming standard structures where fees reduce capital available for investment. African funds typically reserve 40-50% for follow-on investments given the patient capital requirements of the market, somewhat higher than the 30-35% common in US venture funds. This creates an initial deployment pool of approximately $148M and a follow-on pool of $122M.
Across 20 portfolio companies, this translates to $7.4M average initial checks and $6.1M average follow-on capacity per company. The total capital allocation per company over the fund’s life averages $13.5M.
This allocation structure aligns reasonably well with what individual African Series B companies need for any single transaction. The problem emerges when aggregating across portfolio construction and deployment timelines.
To deploy $148M in initial checks over four years requires $37M in new investments annually. At $7.4M per deal, the fund must complete five new investments every year.
Against an addressable deal flow of 12-18 opportunities annually after applying thesis filters, the fund needs to win 28-42% of all relevant deals every single year for four consecutive years.
When 3-4 mega-funds compete for the same deal pool simultaneously, each fund cannot sustain 35-40% market share. The mathematics render full deployment within the standard investment period structurally impossible.
Funds face a choice between deployment discipline and deployment speed. Maintaining investment discipline means passing on marginal opportunities, which extends the deployment timeline to 6-8 years. Prioritizing deployment speed means stretching into suboptimal deals or overpaying to win competitive processes. Both paths degrade returns.
Constraint 3: Governance Bandwidth
Managing African venture portfolios differs fundamentally from managing US portfolios. Regulatory complexity, thin executive talent markets, nascent commercial ecosystems, and infrastructure gaps mean African portfolio companies require 2.5-3x the GP time commitment compared to US equivalents.
A senior partner can effectively manage 4-5 African portfolio companies while maintaining governance quality. A four-partner GP team reaches maximum effective capacity at 16-20 companies before governance quality begins degrading.
The mathematics create a binding constraint. $270M in deployable capital divided by 16 companies equals almost $17M per company—higher than most African Series B companies can absorb productively. Divided by 20 companies, the allocation drops to $13.5M per company, which represents the upper bound of what typical high-growth African companies need over their venture lifecycle.
This places $300M funds at the governance capacity ceiling with zero margin for error. A $500M fund with comparable team structure would need 33 portfolio companies—65% beyond realistic governance bandwidth.
GPs face impossible trade-offs. Expanding the team to 6-8 partners increases fixed costs beyond what management fee economics can support. A $300M fund generates $6M annually in management fees during the investment period. A four-partner team with appropriate support infrastructure burns $4.5-5.5M yearly. The economics work. A 6-8 partner team burns $7-10M annually. The fund size cannot support this overhead without raising management fees to levels LPs will not accept.
The alternative—reducing support per portfolio company to manage more investments with the same team size—degrades governance quality and portfolio company performance. The governance constraint effectively caps fund size around $200-250M of deployable capital, which translates to committed capital of roughly $230-280M.
Constraint 4: Exit Liquidity Ceiling
Total African tech M&A volume is estimated at approximately $2-3B annually across recent vintages based on industry tracking reports, though comprehensive data remains limited given private transaction prevalence. The median exit size distribution shows 65% of transactions below $50M, 25% between $50-150M, and 10% above $150M.
A $300M fund targeting 3.5x net MOIC needs to return $1.05B to LPs. Accounting for management fees and carried interest, this requires generating roughly $1.15-1.25B in gross proceeds.
Across 20 portfolio companies, this implies a $57-62M average exit value. The African median exit sits in the $30-80M range. The fund requires consistently above-median exits across the majority of its portfolio.
The market concentration requirement reveals the severity of the constraint. Achieving $1.2B in exits means capturing 46-48% of total annual African tech M&A volume for 4-5 consecutive years across the exit period.
Multiple mega-funds cannot simultaneously capture 45% of the same market. When 3-4 mega-funds raised between 2021 and 2023 all need to generate similar exit volumes from the same underlying transaction pool, mathematical impossibility emerges. Not all funds can achieve target returns. Some will necessarily underperform because the exit market cannot absorb the aggregate capital seeking liquidity.
Exit liquidity constraints become binding around $200-250M of fund size. These funds need $500-700M in exits over the fund life—achievable against a $2.5B annual market while maintaining reasonable market share assumptions. Beyond $250M, return requirements exceed what the exit market can sustainably absorb without mega-funds capturing implausible shares of total transaction volume.
THE FRAMEWORK
Optimal Fund Size = Constrained by MIN(
  Sustainable Deal Flow Capture,
  Governance Capacity Ceiling,
  Exit Liquidity Requirements
)
Work through a representative pan-African growth fund to demonstrate how constraints bind progressively.
Fund Strategy Parameters:
Geographic focus: Nigeria, Kenya, South Africa
Stage focus: Series B primary with opportunistic Series C
Sector approach: Horizontal across fintech, commerce, logistics
Team structure: 4 investing partners with operational support
Market Opportunity Inputs:
Total Series B and later deals annually in three markets: ~36 opportunities
Addressable after thesis filters (sector fit, stage alignment, competitive position): 50% or 18 deals per year
Investment period: 4 years
Target portfolio size: 20 companies
Fund Size Scenario Analysis:
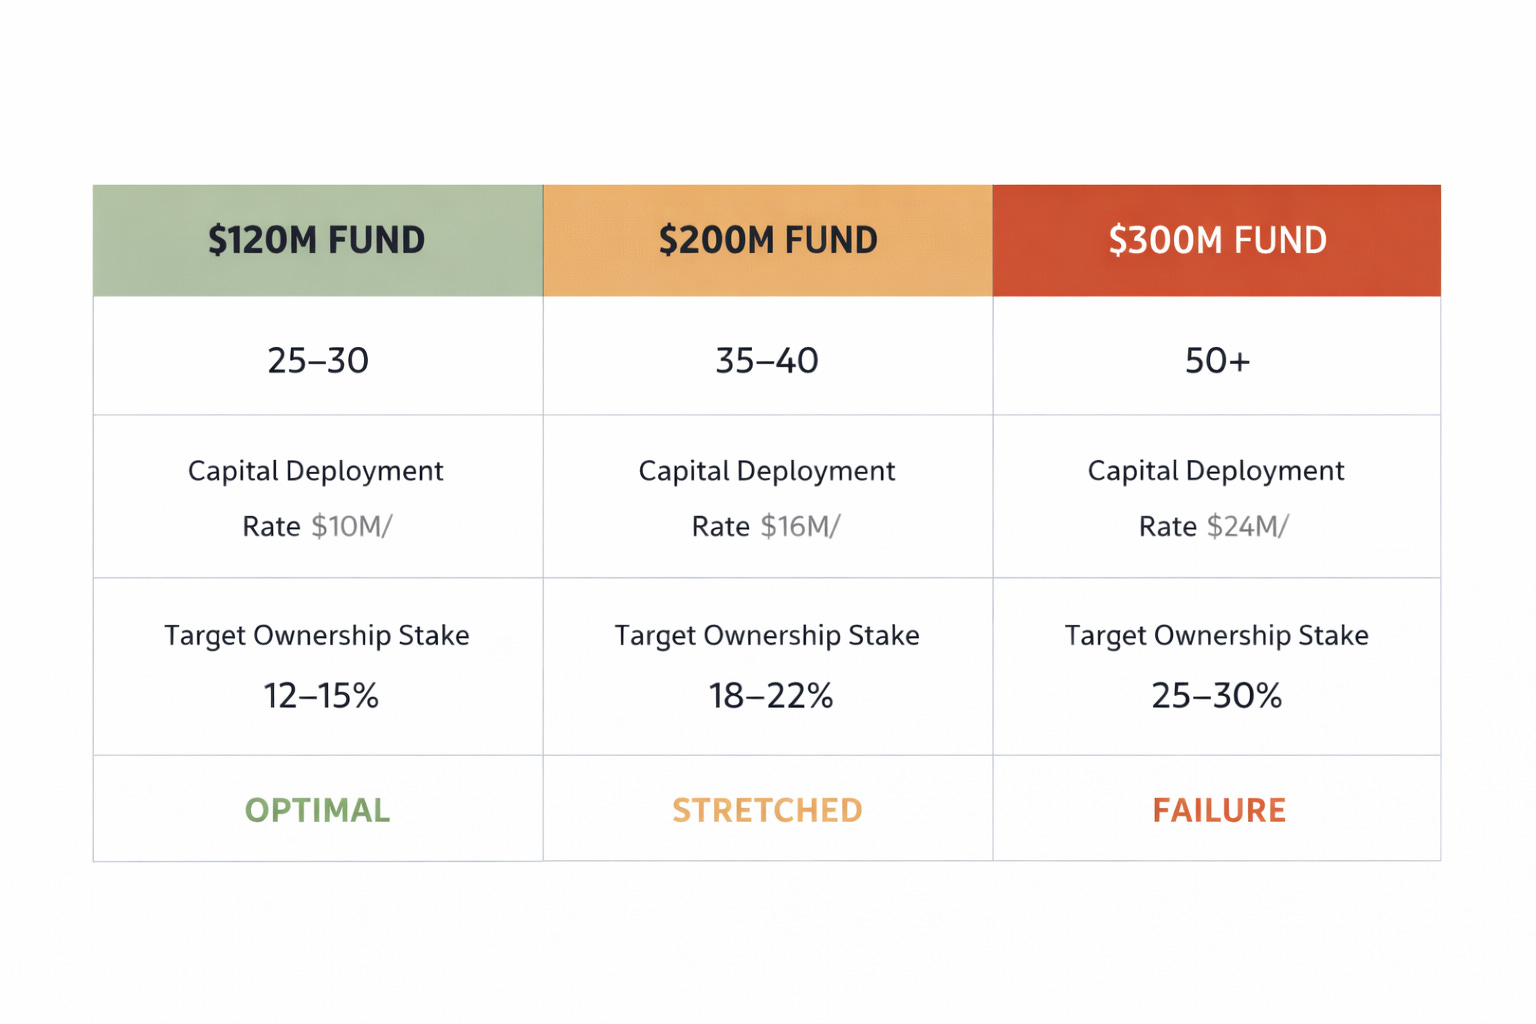
Scenario A: $120M Fund
Deployable capital after fees: $108M Follow-on reserve at 45%: $48.6M Initial deployment pool: $59.4M Average initial check: $3M (20 companies) Total capital per company: $5.4M
Deal flow requirement: 5 deals per year from 18 addressable opportunities equals 28% market share. Sustainable with strong deal sourcing and selection discipline.
Governance capacity: 20 companies across 4 partners equals 5 companies per partner. At the upper bound of sustainable capacity but manageable with quality operational support infrastructure.
Exit requirement: Target 3.5x net MOIC requires $420M gross proceeds. Against $2.5B annual exit volume, this represents 17% market share over the exit period. Highly achievable.
Assessment: Operates comfortably within all constraint boundaries. Optimal deployment efficiency expected.
Scenario B: $200M Fund
Deployable capital after fees: $180M Follow-on reserve at 45%: $81M Initial deployment pool: $99M Average initial check: $5M (20 companies) Total capital per company: $9M
Deal flow requirement: 5 deals per year from 18 addressable opportunities equals 28% market share. Still sustainable but requires consistent execution.
Governance capacity: 20 companies across 4 partners equals 5 companies per partner. At governance capacity ceiling with minimal buffer for complexity variation across portfolio.
Exit requirement: Target 3.5x net MOIC requires $700M gross proceeds. Against $2.5B annual exit volume, this represents 28% market share over the exit period. Achievable but requires strong portfolio performance.
Assessment: Operating at constraint boundaries. Deployment efficiency good but margins thin. Performance highly sensitive to execution quality.
Scenario C: $300M Fund
Deployable capital after fees: $270M Follow-on reserve at 45%: $121.5M Initial deployment pool: $148.5M Average initial check: $7.4M (20 companies) Total capital per company: $13.5M
Deal flow requirement: 5 deals per year from 18 addressable opportunities equals 28% market share. Multiple mega-funds competing for same deals makes this market share difficult to sustain consistently.
Governance capacity: 20 companies across 4 partners equals 5 companies per partner. At maximum governance capacity with no buffer. Any portfolio company requiring above-average support time creates capacity overflow.
Exit requirement: Target 3.5x net MOIC requires $1.05B to LPs or approximately $1.2B gross proceeds. Against $2.5B annual exit volume, this represents 48% market share over the exit period. Requires capturing nearly half of all African tech exits for multiple consecutive years. Structurally difficult when multiple mega-funds need similar exit volumes.
Assessment: Exceeds sustainable constraint boundaries. Exit liquidity constraint binds severely. Governance capacity at absolute ceiling. Deployment likely extends beyond standard investment period. Systematic underperformance risk high.
THE EVIDENCE
Observable deployment data across fund vintages validates the inverse scale relationship.
Observable investment activity from mega-funds above $200M raised between 2021 and 2023 suggests annual deployment rates tracking between 18-22% based on publicly announced deals. Right-sized funds below $100M from the same vintages show 28-35% annual deployment rates.
Track a representative $300M fund raised in 2021. Year 1 deployed $45M representing 15% of committed capital. Year 2 deployed $72M at 24%. Year 3 deployed $55M at 18%. Year 4 deployed $48M at 16%. Total deployment through Year 4 reached $220M or 73% of committed capital. The fund remains short of full deployment and will require Years 5-6 to complete its investment program.
Contrast this with a $75M fund raised in 2021. Year 1 deployed $18M at 24%. Year 2 deployed $22M at 29%. Year 3 deployed $20M at 27%. Year 4 deployed $12M at 16%. Total deployment reached $72M representing 96% of committed capital. The fund achieved full deployment within the standard investment period.
The pattern holds consistently across multiple vintages. Smaller funds complete deployment programs in 4-5 years. Mega-funds require 6-8 years to achieve comparable deployment levels.
The performance differential emerges from structural advantages right-sized funds maintain.
Check size flexibility allows participation across Series A deals at $4-8M and Series B transactions at $10-15M. These funds do not face pressure to inflate check sizes to meet deployment velocity targets. Portfolio construction aligns naturally with company funding requirements at each stage.
Deal flow access expands because these funds need 30-40 total investments rather than the 20-25 that mega-funds target. The wider funnel means funds can participate in earlier Series A rounds and follow promising companies into Series B. They are not competing exclusively for scarce late-stage mega-rounds where competition concentrates.
Governance bandwidth supports 15-20 portfolio companies comfortably within a 3-4 partner team structure. Partners can provide meaningful operational support to each portfolio company. Governance quality improvements translate directly into portfolio performance gains.
Exit requirements become dramatically more achievable. Funds need $225-350M in exits versus $1B or more for mega-funds. This target is achievable with 3-4 strong exits generating $50-100M each plus a portfolio of smaller successful outcomes. These funds do not need to capture 40% of total market exit volume to hit return targets.
STRATEGIC IMPLICATIONS
The inverse scale dynamic in African VC is not a temporary market inefficiency. It reflects fundamental structural realities that persist across market cycles.
LPs should recalibrate allocation strategies. The assumption that bigger African funds deliver better returns does not survive empirical scrutiny. Larger funds face binding constraints that smaller funds navigate successfully. LPs generate better risk-adjusted returns by allocating to 2-3 funds in the $75-150M range rather than concentrating capital in a single $300M vehicle.
This approach diversifies GP execution risk, increases the probability of full deployment within standard time horizons, and improves aggregate governance quality across the portfolio. The LP’s effective exposure to the African venture ecosystem actually expands because right-sized funds can access broader deal flow and deploy more efficiently.
During due diligence processes, LPs should demand rigorous deployment mathematics. Ask GPs to demonstrate how many addressable deals exist annually in target markets after applying all thesis filters. Require explicit articulation of what market share the fund needs to capture to achieve full deployment within the stated investment period. Demand clarity on what percentage of total African exit volume the fund must capture to deliver target returns.
Red flag any fund above $200M that cannot provide convincing answers to these questions or that lacks a genuine multi-stage strategy expanding addressable deal flow across the venture lifecycle.
Adjust return expectations based on fund size. Right-sized African VC funds between $75M and $150M can realistically target 3.5-4.5x net MOIC. Mega-funds above $250M face deployment drag, valuation pressure from oversized checks, and exit liquidity constraints that make 2.5-3.5x net MOIC more realistic. LPs should price these different return profiles into allocation decisions and fee negotiations.
GPs should resist LP pressure to raise progressively larger funds without clear strategic rationale. When an LP suggests raising $200M for Fund II after a successful $75M Fund I, respond with deployment mathematics rather than aspirational growth narratives.
Present the Deployable Capital Ceiling analysis for the specific strategy, markets, and team structure. Frame optimal fund size as strategic advantage rather than limitation. Articulate clearly why $120M enables maximum deployment efficiency and governance quality while $200M introduces binding constraints that degrade performance.
Demonstrate understanding of market structure by showing LPs the mega-fund deployment data. Emphasize that achieving 90%+ deployment in four years creates faster LP liquidity than mega-funds requiring 6-8 years to deploy fully. Speed to deployment and speed to returns matter enormously for LP portfolio construction.
If GPs want to manage assets under management above $150M, build genuine multi-stage capability across Seed through Series C. This strategy expands addressable deal flow significantly by allowing $2M Seed checks and $20M Series C investments from the same vehicle. But this approach requires different team structures with stage-specialist partners rather than generalist investors attempting to cover the entire spectrum.
Emerging managers should position right-sized fund strategy as competitive advantage in fundraising conversations. Demonstrate to LPs that the $300M mega-funds raised in 2021 and 2022 are tracking 60-70% deployment after four years while comparable right-sized funds achieved 90%+ deployment in the same period.
Show LPs the governance quality advantage. Emphasize that managing 18 portfolio companies across 3 partners allows meaningful engagement with each company whereas mega-funds stretched across 35 companies with 4 partners cannot provide comparable support.
Frame the LP’s allocation decision explicitly. Compare committing $50M to a $300M mega-fund where they represent 16% of the fund and function as price-takers on terms versus committing the same $50M to a $100M emerging manager fund where they represent 50% of capital, can negotiate better terms, and receive substantially more attention from the GP team.
As mega-fund deployment struggles become increasingly visible to the institutional LP community, this positioning strengthens materially.
WHAT THIS MEANS
Silicon Valley VC economics assume that more capital translates into more deals, which generates better returns through scale economies.
African VC reality inverts every element of this relationship. More capital translates into fewer addressable deals after accounting for ticket size requirements and competitive dynamics. Governance capacity constraints bind more severely as portfolio size expands. Exit liquidity ceilings create mathematical impossibility for multiple mega-funds to achieve target returns simultaneously. The result is scale diseconomies, not scale economies.
The $500M African VC fund is not sophisticated evolution of the asset class. It represents structural mismatch between fund size and market capacity.
Observable data demonstrates that mega-funds cannot deploy efficiently. This is not because GPs lack competence. It is because market structure makes efficient deployment impossible at that scale. Deal scarcity limits opportunities. Deployment rate requirements force unsustainable market share capture across limited deal flow. Governance bandwidth constraints prevent effective portfolio support. Exit liquidity ceilings mean return requirements exceed what the M&A market can absorb.
These are not operational problems that better execution can solve. They are structural constraints that funds must acknowledge and optimize around.
Right-sized funds are not smaller ambitions or limited vision. They represent better-calibrated capital allocation that aligns fund economics with market realities. Optimal deployment efficiency occurs between $75M and $150M. Performance degrades progressively between $150M and $250M. Above $250M, binding constraints create systematic underperformance.
The question is not whether African VC can support mega-funds. The data demonstrates conclusively that it cannot—not without extended deployment timelines, valuation indiscipline, governance quality degradation, or return expectations that exceed what exit markets can deliver.
The question is whether the industry will acknowledge the inverse scale dynamic and optimize fund sizing accordingly. LPs who recognize this reality will allocate to right-sized funds and capture superior risk-adjusted returns. GPs who resist mega-fund pressure will deploy efficiently and outperform on meaningful metrics. Founders who understand the dynamics will avoid capital from overstretched mega-funds desperate to deploy regardless of valuation discipline.
The ceiling exists. Market structure created it. Observable data confirms it. The only remaining choice is whether to acknowledge it before capital gets misallocated or after.