
The Market Isn’t 223 Million: Measuring the Real Nigeria
EETAM — the framework redefining Africa’s Total Addressable Market


Every startup pitch in Africa begins with a lie — a population number. Yet only a fraction of that population earns, spends, or transacts digitally with any regularity. Nigeria’s 223 million headline quickly collapses to 51 million economically active, connected adults, and just 24.5 million who can spend at least $10 monthly online. That’s the EETAM lens — a quantified correction that turns ambition into arithmetic. Because if your CAC, LTV, and payback math still assume 200 million users, you’re not scaling; you’re hallucinating.
EETAM — Effective Economic Total Addressable Market — doesn’t replace TAM; it rescues it.
It filters the noise through two layers of reality:
first, EAAB (Economically Active Adult Base) — who could participate; then, EETAM — who actually does.
That’s the two-stage process that finally measures the market that pays.
Stage 1: EAAB — who even could participate?
EAAB filters headline population to adults engaged in a monetized, reachable economy.
EAAB = Population × working-age × connected × monetary economy
Nigeria 2024:
223M → 51.3M EAAB (people who can participate economically)
“Connected” means urban residents plus rural areas with reliable internet.
“Monetary economy” means formal or semi-formal income — excludes pure subsistence.
Stage 2: EETAM — who actually does participate?
From EAAB, pass four gates:
Earnings: regular income above subsistence
Digital access: smartphone + active weekly internet use
Affordability: ≥$10 monthly discretionary digital spend (see The $10 Customer Problem)
Transaction regularity: ≥4 digital transactions per month across ≥2 categories
Nigeria 2024 result: EETAM = 24.5M
If your service costs ₦3,000 (~$2) per month, only those within that 24.5M base who can clear that threshold are reachable — not the 223M headline.
Breadth vs depth
Breadth = users.
Depth = users × ARPU × frequency.
ARPU (Average Revenue Per User) measures monthly spend per user.
The depth metric is EMRP (Effective Market Revenue Potential) — the total revenue pool every startup in a market competes for. Think of it as Total Addressable Revenue.
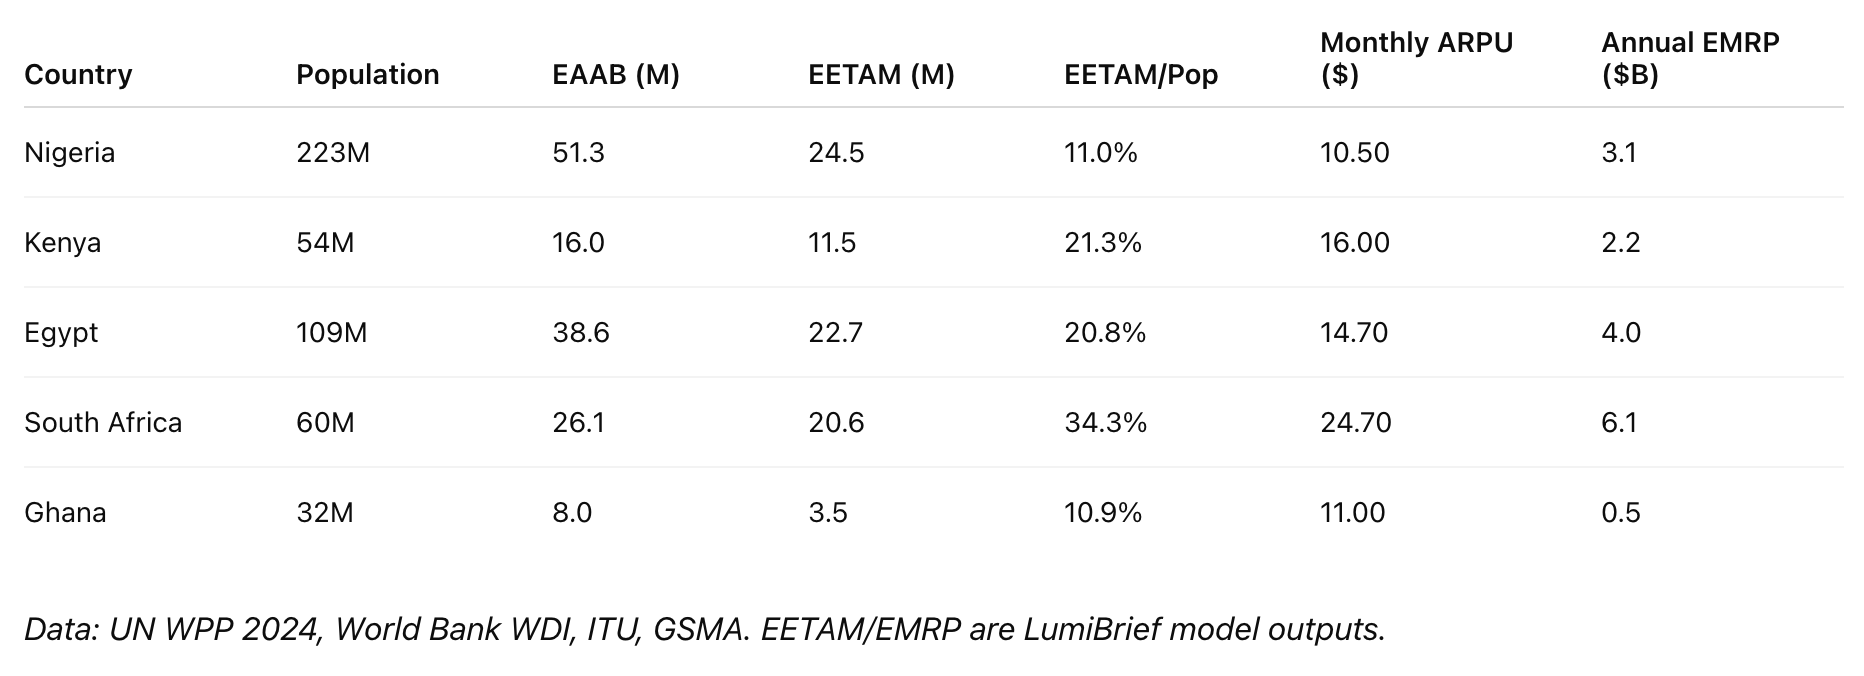
South Africa has one-quarter Nigeria’s population but twice the market revenue. That’s depth.
Example: CAC reality check
A Nigerian fintech startup modeling against 223M assumes 1% penetration = 2.23M users, spends $2M, and ends up with 8,800 active users.
CAC (Customer Acquisition Cost) = $227 per user.
The same startup modeling against 24.5M EETAM assumes 1% = 245k users, targets EETAM-qualified consumers, and acquires 27,000 users for $1.2M.
CAC = $44 per user.
Net impact:
3× more users
5× better CAC
$800k saved + 18 months extra runway
Difference between shutdown and Series A
Operator takeaways
Model EAAB first — Use 51M, not 223M, for Nigeria’s denominator
Price by affordability bands — ₦1k/₦3k/₦6k tiers mapped to ARPU levels
Recast CAC, LTV, and payback on EETAM — If CAC = $12 and EETAM = 24.5M, your 1% capture is 245k users, not 2.23M
Chase frequency, not installs — Bill-pay, wallet top-ups, inventory restock drive revenue faster than downloads
The accompanying premium post shares the full dataset, market depth matrix, and application playbooks for founders, funds, and policymakers.
👉 Subscribe for the operator version: