

Last week’s essay introduced the Unit Identification Protocol — four tests that determine whether the unit you’re measuring is real. If you haven’t read it, start there. This post — for paid subscribers like yourself, only — delivers the implementation layer: the diagnostic template, a worked example, and the bridge to CAMEL stress-testing. [Note: This should have been published mid-week, but some exciting projects — sourced through readers have been taking up my time of late. Hope to share more soon]
The protocol applies across sectors. Fintech, logistics, agritech, healthtech, infrastructure. The tests are universal. The evidence required shifts by business model.
These thresholds are calibrated to African market realities. In lower-friction environments, you might tolerate 40% commercial transaction rates during early scaling. In African markets — where every non-commercial user consumed acquisition spend, support bandwidth, and runway — 50% is the floor. Below that, your unit economics are denominated in fiction.
The Diagnostic Template
Test 1: Existence
What percentage of your reported users or customers have transacted at commercial terms — no promo, no subsidy?
A logistics company counting “registered shippers” who never booked a load. A SaaS platform counting “sign-ups” who never activated. Existence unvalidated.
Data required: Cohort (customers grouped by acquisition period or channel) breakdown, promo versus organic acquisition.
Red flag: Below 50% commercial transactions.
Action if failed: Redefine unit to commercial-only. Rebase all metrics.
Test 2: Repeatability
What percentage of customers transact three or more times within the relevant cycle?
An edtech platform with 80% single-course completion, zero re-enrollment. A B2B supplier with 70% one-time purchase orders. Trial without adoption.
Data required: Retention curves (how many customers from each intake period remain active over time), transaction frequency distribution (how transactions spread across your customer base — are 10% of customers generating 80% of volume?).
Red flag: Below 30% repeat rate.
Action if failed: Identify the repeat segment. Rebuild economics around that subset.
Test 3: Monetisability
What is your net margin per transaction or contract after all variable costs?
An agritech platform facilitating impressive input volumes — margin captured at manufacturer level, not platform level. Volume without margin.
Data required: Gross take rate (percentage of transaction value captured as revenue), processing costs, fulfilment, fraud, support.
Red flag: Below 1% net margin.
Action if failed: Reprice, reduce cost stack, or accept pass-through positioning (acknowledging you facilitate transactions without capturing meaningful margin — a distribution play, not a margin business).
Test 4: Measurability
What percentage of your active users or customers are verified unique entities?
A healthtech app where 30% of “patients” are agents booking on behalf of multiple individuals. A fintech where SIM-swap behaviour destabilises identity tracking. Phantom cohorts.
Data required: Duplicate analysis, agent intermediation audit, identity verification rate.
Red flag: Above 20% unverified or duplicate.
Action if failed: Invest in verification infrastructure. Discount reported metrics accordingly.
Worked Example: Cold-Chain Infrastructure
A company building cold storage facilities across secondary Nigerian cities. Reports 45 contracted clients — food processors, pharmaceutical distributors, agricultural exporters. Monthly revenue of $25,000. Raised seed at $4.5M valuation — 15x trailing revenue (valuation based on revenue already earned, not projections), priced on expansion potential.
Run the protocol.
Existence: Of 45 contracted clients, how many pay full commercial rates versus promotional trial rates? Investigation reveals 28 are on discounted “first 6 months” terms. Seventeen paying commercial rates. Existence-validated units: 17.
Repeatability: Of those 17 commercial clients, how many have renewed or extended? Eleven have renewed at least once. Six are within first contract period — too early to assess. Repeat-validated units: 11 confirmed, 6 pending.
Monetisability: Revenue per client looks strong, but what’s the margin after energy, maintenance, security, insurance? Net margin per facility runs at 8% after operational costs. Viable but thin, with sensitivity to diesel price shocks. Passes threshold.
Measurability: Each client is a registered business with verifiable contracts. No intermediation ambiguity. Clean.
Result: Reported 45 clients narrows to 11-17 validated units. The revenue base supporting that $4.5M valuation is thinner than the deck suggests. Investor either reprices or requires a pathway to converting the 28 subsidised clients to commercial terms.
Infrastructure ventures often pass measurability easily — contracts are legible. They fail existence and repeatability when promotional terms mask commercial viability.
UIP → CAMEL Integration
UIP answers: Is this a real unit?
CAMEL answers: Will this unit survive stress?
Sequence matters. Running CAMEL on phantom units produces false confidence. Resilience metrics look reasonable — denominated in fiction.
Once a venture passes UIP, CAMEL applies:
Capital Efficiency calculated against verified units. CAC (cost to acquire each customer) and LTV (total expected revenue over the relationship) denominated in real demand.
Adaptability scenario-tested against units with demonstrated commercial behaviour — revealed price sensitivity, channel preference, retention triggers.
Margin Architecture built on actual net margin per verified transaction. Not gross margin on inflated volume.
Efficiency measured on validated cohorts. “Lifetime” means something because the unit has demonstrated repeat behaviour.
Liquidity Runway measured as burn rate per real unit acquired. Realistic cash-out timeline based on verified demand.
UIP first. CAMEL second. Foundation before architecture.
Investor Application
Three screening questions for first calls:
One: What percentage of your reported users have transacted at full commercial terms — no promo, no subsidy?
Two: Of those, what percentage have transacted more than once in the relevant cycle?
Three: How do you verify that your active user count reflects unique individuals rather than duplicates or intermediaries?
Founders who answer crisply, with data, signal unit discipline. Founders who hesitate or pivot to top-line metrics signal risk.
These questions surface unit identification problems before deep diligence. Saves cycles. Avoids the pattern where impressive decks collapse under data-room scrutiny.
The Template
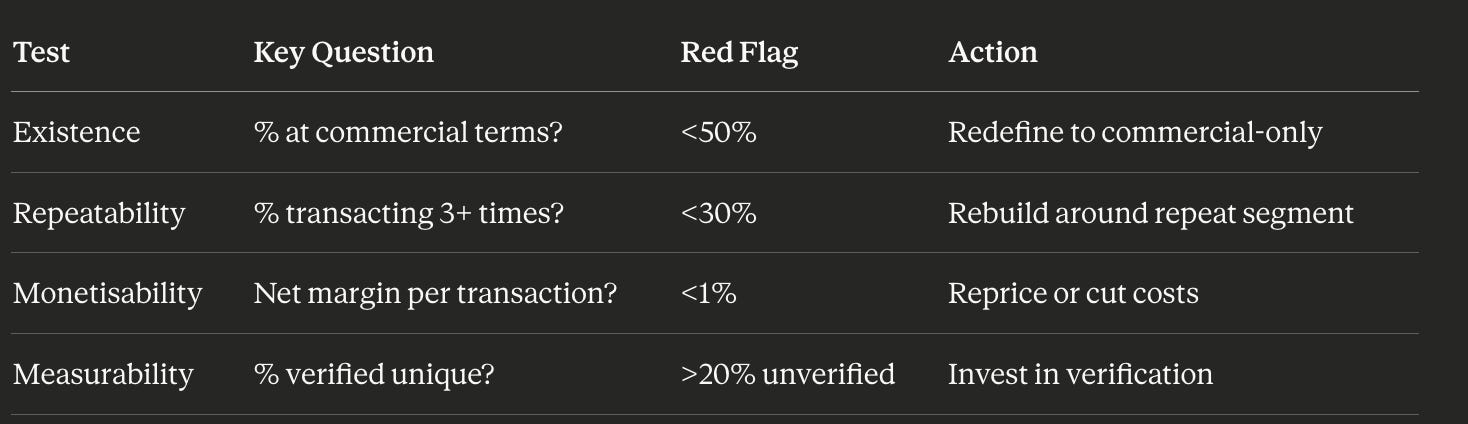
A unit must pass all four. Economics against failed units produce fiction.
If the Protocol Surfaces Problems
Two options.
Fix the unit — tighten acquisition to commercial-only, invest in verification, reprice for margin.
Or reframe the narrative — present your validated unit count honestly, show the pathway to expanding it, and let investors price real demand rather than discovering phantom units in diligence.
The second approach sounds painful. It’s less painful than a down round eighteen months later when the phantoms evaporate.
If you run this protocol and surface something unexpected, reply to this email. Building a library of anonymised case studies for future issues.