
The $270M Music IP Market African Banks Are Missing—And How Direct Payment Unlocks It
Why the same catalogue supports 20% more debt through structure alone—and what this reveals about making knowledge economies operational

The 20% Gap
Two Nigerian banks finance the same music catalogue. Same artist, same streaming numbers, same $1.79M valuation from the same appraiser.
Bank A (traditional structure):
Lends $356,772 at 23.5% interest —if it lends at all
Bank B (direct payment structure):
Lends $427,380 at 14% interest
Difference: 20% more lending capacity. 950 basis points lower cost. $70,608 in interest savings over four years.
Six months later, Bank A’s credit committee asks: “How did we lose that deal?”
Bank B didn’t have better risk appetite. It had better legal design. The bank embedded letters of direction with Spotify, Apple Music, and YouTube into the security package. This transformed the credit from “loan secured by illiquid IP collateral” to “loan secured by contractual payment streams from investment-grade counterparties.”
Same asset. Different structure. And that structural difference unlocks a $270M lending market that’s currently 97% unserved.
This essay unpacks how direct payment works, why it matters beyond music, and what it reveals about making knowledge economies operational in low-trust environments.
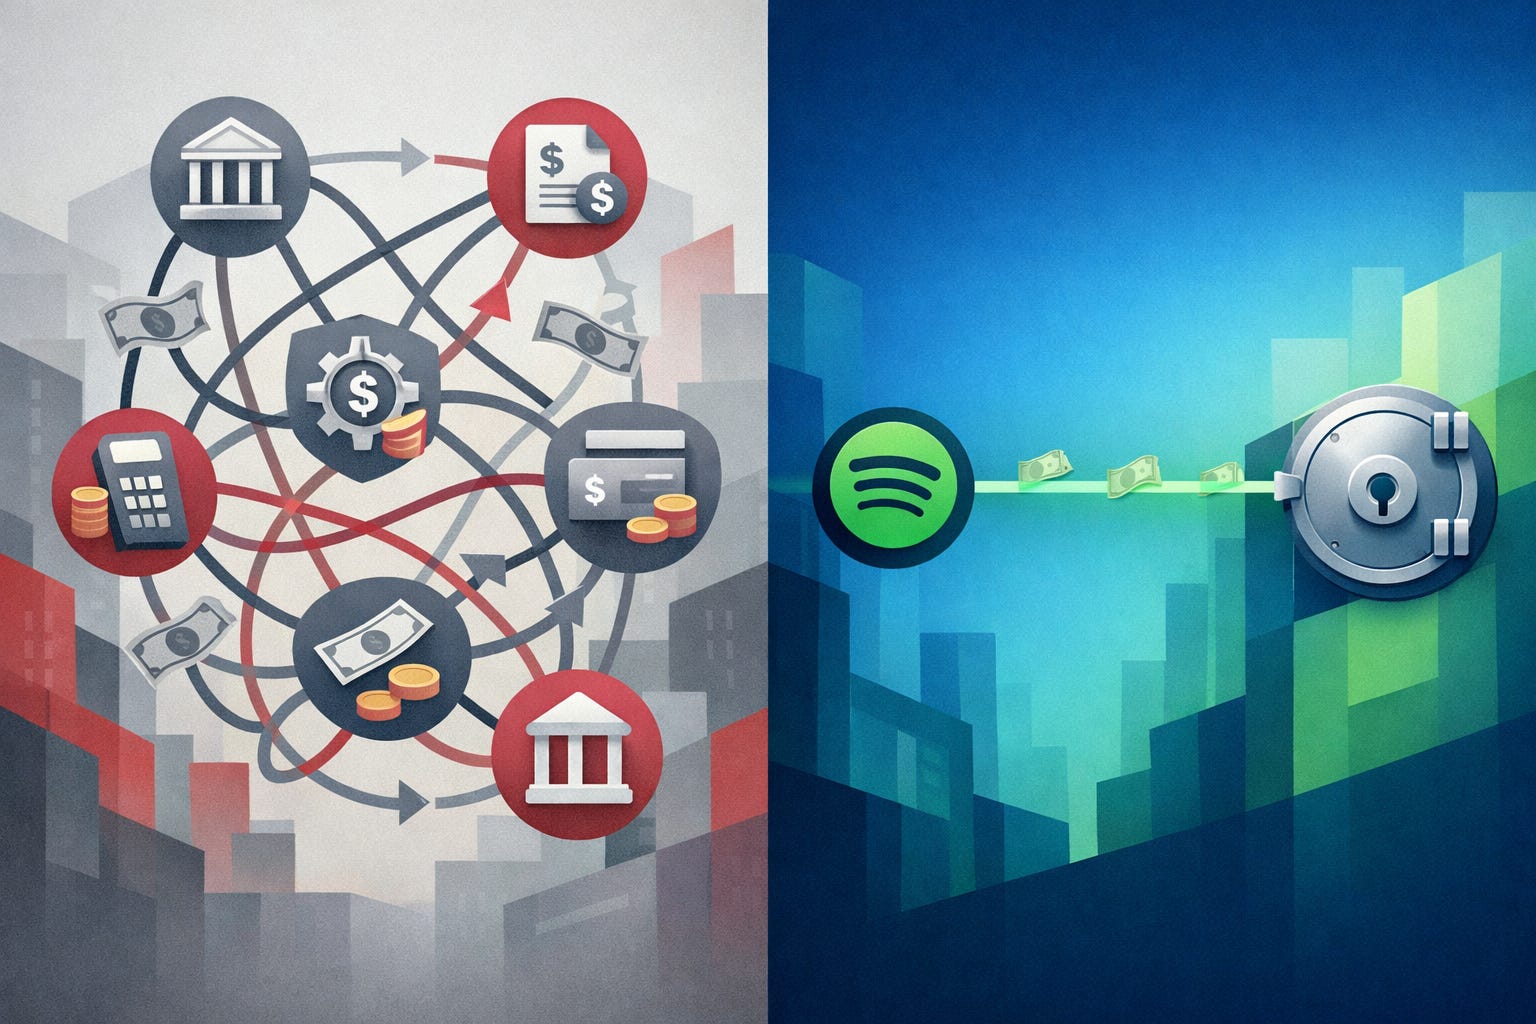
What Direct Payment Actually Is
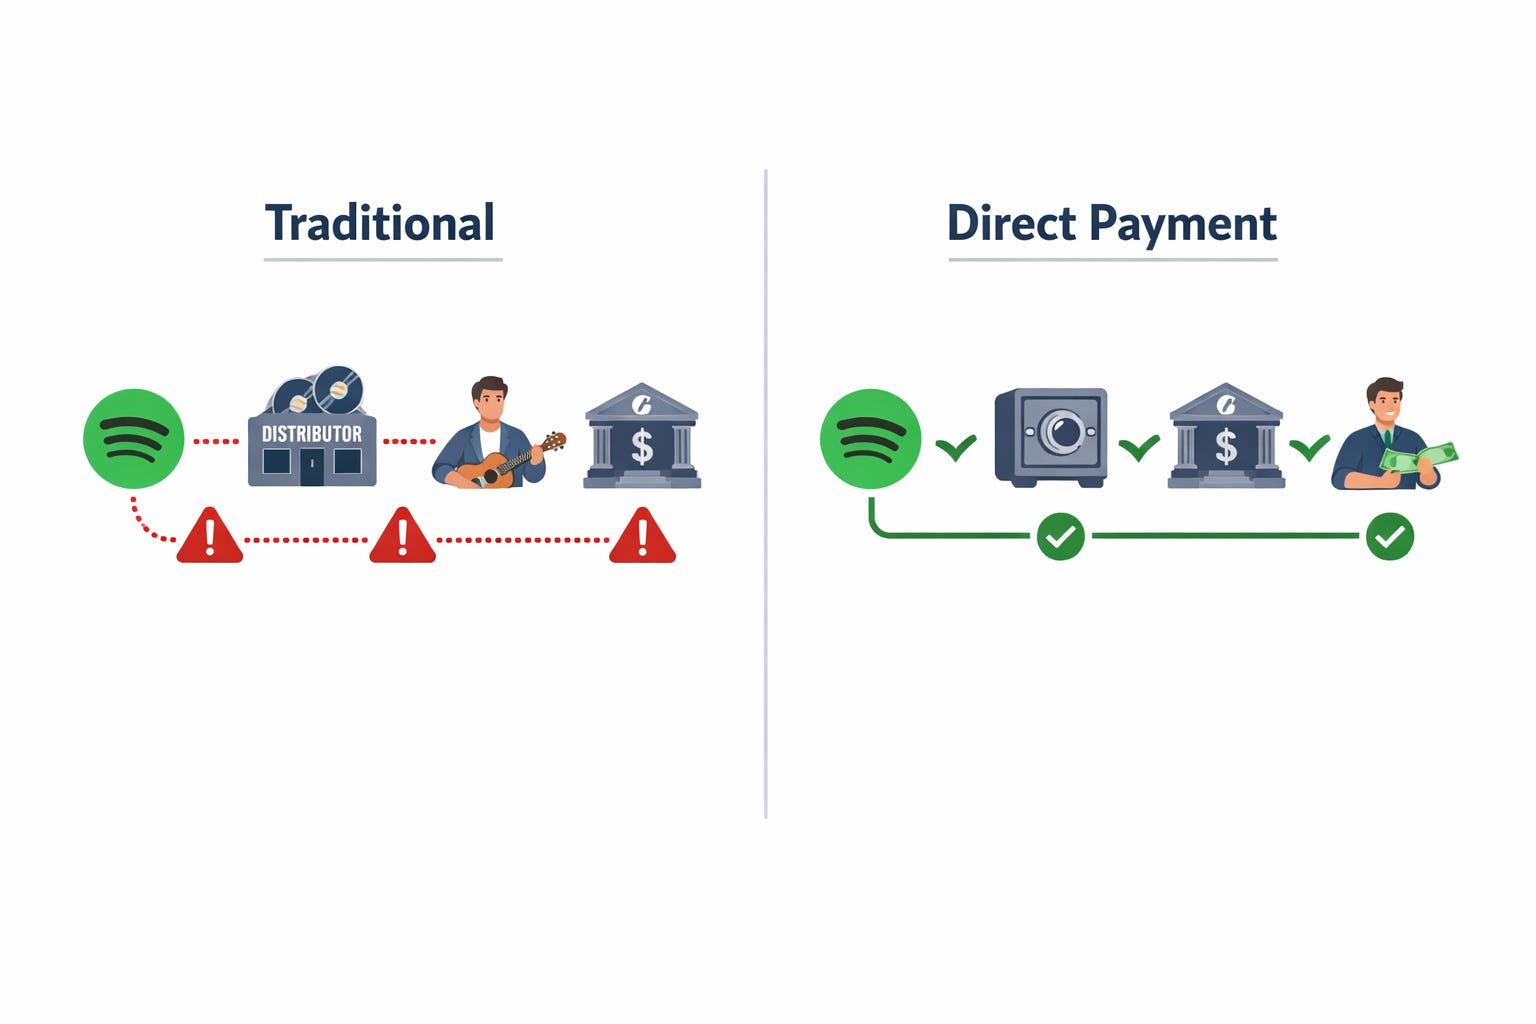
Here’s how music IP lending normally works:
Traditional Structure:
Spotify → Distributor → Artist → Lender (maybe)
The lender depends on the borrower to service debt from catalogue earnings. If the borrower defaults, the lender must seize the catalogue, find a buyer, negotiate a sale. This takes 8-16 months and recovers 45-60% of appraised value.
Now here’s the restructured version:
Direct Payment Structure:
Spotify → Lender-Controlled Account → Debt Service → Borrower (excess only)
Letter of Direction: A legal instruction from the borrower directing Spotify to pay royalties directly into a lender-controlled bank account. Once Spotify acknowledges the letter, the instruction is irrevocable and survives borrower bankruptcy.
The borrower never touches 80% of the money. If the borrower defaults on the remaining 20%, the lender doesn’t seize anything. The controlled 80% keeps flowing. The lender just continues collecting from Spotify until the loan amortizes.
What This Changes
Under the traditional structure, the lender faces borrower default risk on 100% of revenue.
Under direct payment, the lender faces:
Platform counterparty risk on 80% of revenue (Spotify = investment grade)
Borrower counterparty risk on 20% of revenue (Nigerian artist = high risk)
This isn’t just incremental. It’s categorical.
When 80% of your credit exposure shifts from a Nigerian artist to Spotify’s balance sheet, you’re lending to a different entity entirely.
The Math
Let’s quantify what direct payment does to the same $1.79M catalogue.
Scenario A: No Direct Payment
The bank assumes it might need to sell the catalogue in a distressed scenario. It applies these discounts:
Base illiquidity (thin markets):     +25%
Forced sale discount:                +10%
Market depth (small catalogue):      +5%
Enforcement risk (courts/title):     +7.4%
Documentation quality bonus:         -5%
─────────────────────────────────────────────────
Total liquidity discount:           42.4%
Why 42.4%? Because the bank plans for the worst case: borrower defaults, court seizure takes 3-6 months, buyer search takes 3-6 months, transaction closes in 2-4 months. Total timeline: 8-16 months. Transaction costs: 8-10%. Buyer pool: 30-50 active participants for catalogues under $2M.
The numbers stack:
Appraised value:                         $1,786,272
After 42.4% discount:                    $1,029,293
Lend 60% of that (LTV):                    $617,576
But there’s a second constraint: cashflow serviceability.
The catalogue generates $198,043 in annual cashflow (after stress-testing for revenue declines, platform fee increases, FX shocks). Banks require 1.35× debt service coverage—meaning cashflow must be 35% higher than annual debt payments.
DSCR (Debt Service Coverage Ratio): Annual cashflow divided by annual debt payments. A 1.35× DSCR means the catalogue generates $1.35 for every $1.00 of debt service—providing a 35% cushion.
At 23.5% interest over 4 years:
Sustainable annual debt service:    $198,043 ÷ 1.35 = $146,698
Maximum loan at 23.5%:              $356,772
How this is calculated: Using loan amortization, a 4-year loan at 23.5% interest requires $146,698 annual payment to support a $356,772 principal.
The cashflow constraint binds first (collateral would support up to $617k, but cashflow limits to $357k). Maximum loan: $356,772 at 23.5% interest.
Scenario B: 80% Direct Payment
Now the bank applies the direct payment reduction:
Base illiquidity:               +25%
Forced sale (orderly possible): +5%
Market depth:                   +5%
Enforcement risk (platforms):   +3.2%
Direct payment reduction:       -15.2%
Documentation bonus:            -5%
──────────────────────────────────────────Total liquidity discount:       18.0%
Why does direct payment reduce the discount by 15.2%?
Because 80% of revenue now flows through Spotify/Apple/YouTube, not through the borrower. The bank isn’t modeling “how long to liquidate the catalogue.” It’s modeling “how reliable are Spotify’s payment systems.”
Spotify has 95%+ payment reliability (measured by historical platform uptime and payment consistency). The bank applies this reliability factor to the 80% controlled revenue share, then multiplies by 20% (the maximum liquidity benefit from perfect direct payment coverage).
Formula: 80% coverage × 95% reliability × 20% maximum benefit = 15.2% discount reduction.
The numbers shift:
Appraised value:                         $1,786,272
After 18% discount:                      $1,464,743
Lend 60% of that (LTV):                    $878,846
And on cashflow capacity:
Sustainable annual debt service:    $198,043 ÷ 1.35 = $146,698
Maximum loan at 14%:                $427,380
Why does interest drop from 23.5% to 14%?
The bank’s pricing formula builds from risk-free rate (15% Nigerian T-Bills for 364-day tenor, averaging recent market conditions) and adds premiums for each risk:
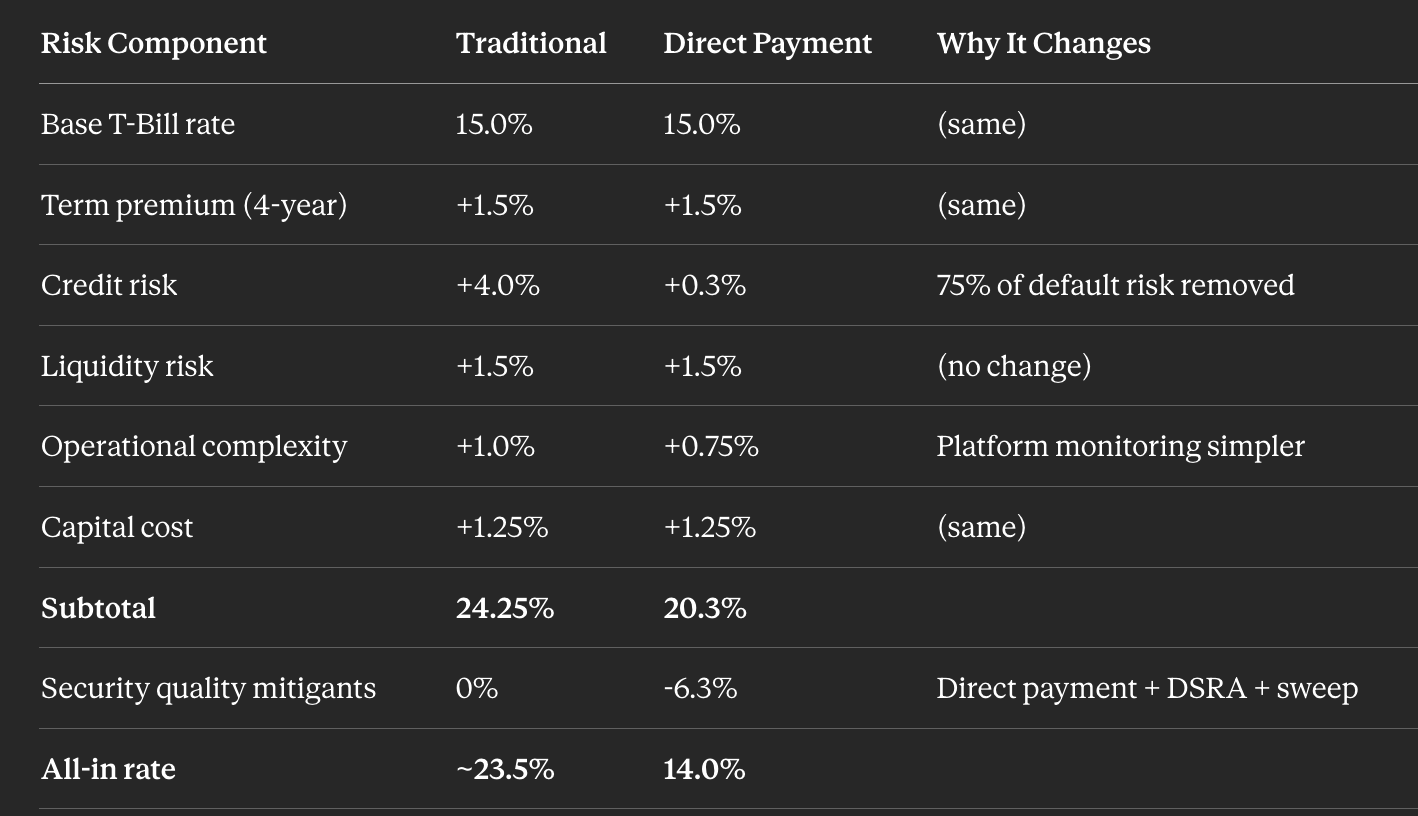
The cashflow constraint still binds, but at a higher threshold. Maximum loan: $569,184 at 14% interest.
The Result

Value creation: Same annual cashflow supports 20% more borrowing while reducing total interest cost by $70,608 (31% savings). The borrower accesses an additional $70,608 in principal while paying the same total amount over the loan term.
Same catalogue. Same cashflows. Same debt service capacity. The only difference is payment routing—and that structural change converts $70,608 from interest expense into borrowed principal.
Why Structure Beats Capital
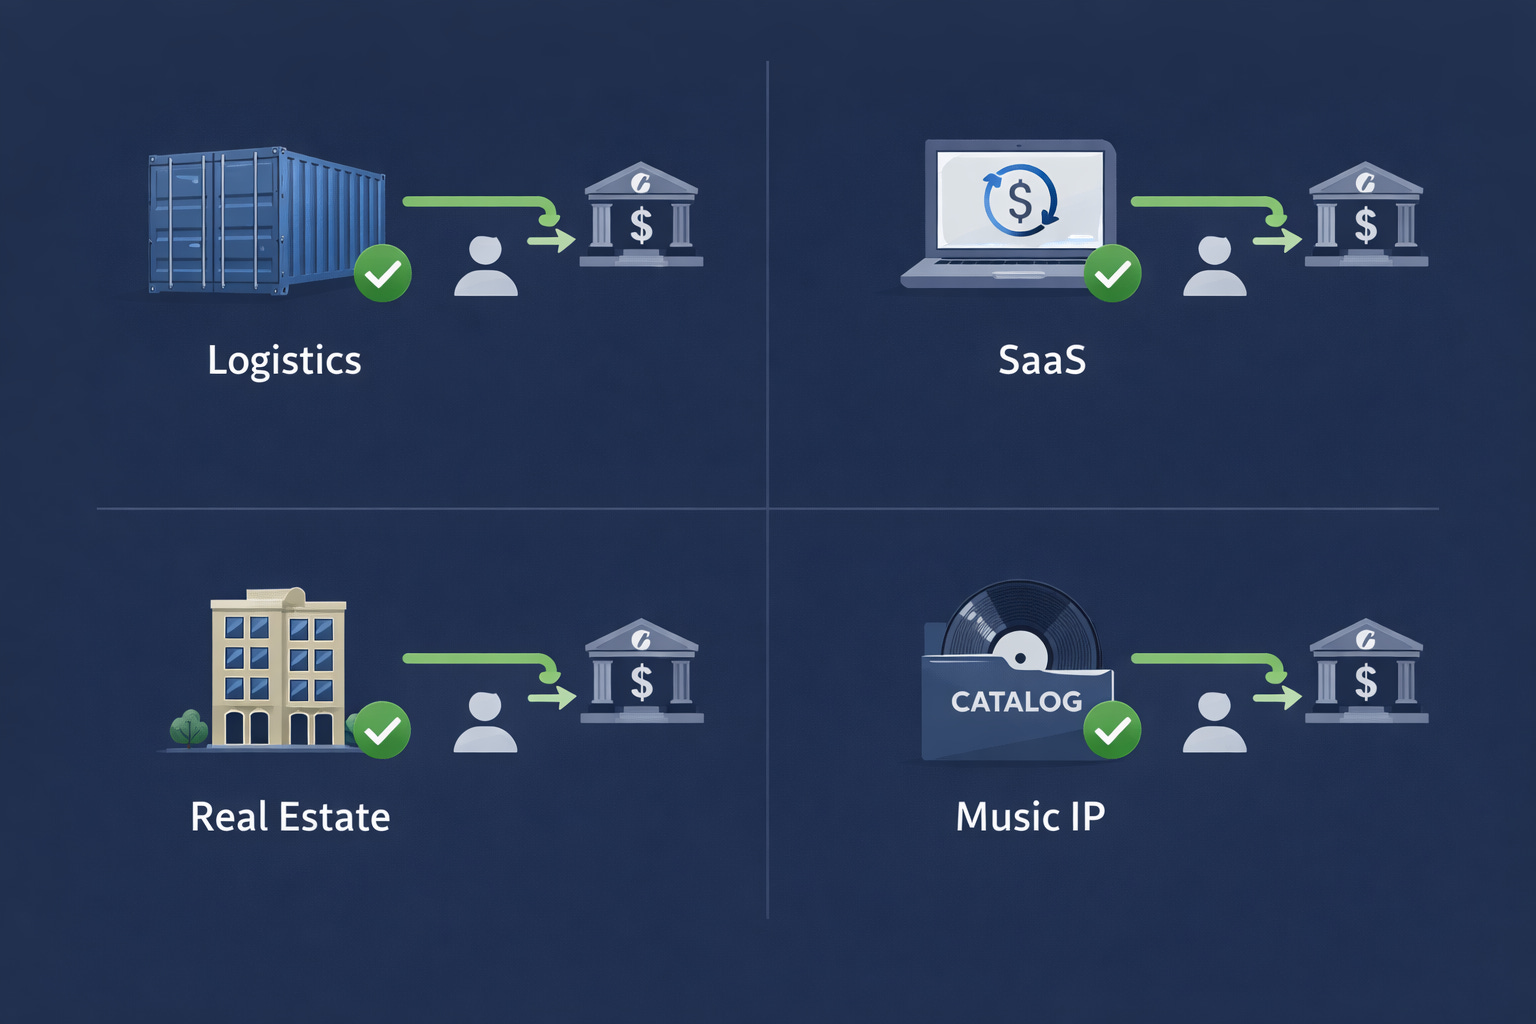
Direct payment isn’t actually about music. It’s about how frontier markets bypass trust deficits through design.
There’s a pattern:
Problem: Banks don’t trust borrowersTraditional solution: Require more collateral, charge higher rates, lend lessDesign solution: Remove the borrower from the payment chain
This works wherever:
Cashflows are contractual and verifiable
Payers are more creditworthy than borrowers
Payment intercept is legally enforceable
The Pattern Across Asset Classes
Export receivables → Letter of credit routes payment through lender → trade finance at 10-12% instead of 18-20%
SaaS subscriptions → Stripe remits directly to lender before founder → ARR lending at 15-18% instead of 22-28%
Rental income → Tenant payment app routes to lender-controlled account → rental-backed lending at 13-15% instead of 20-22%
In every case, intercepting cashflows before they reach the borrower reduces rates by 600-800 basis points.
The Camel Connection
This connects to capital efficiency at the venture level.
In “The Camel Imperative”, I argued African ventures need:
Positive unit economics from Day 1
FX-hedged revenue (hard currency income, local currency costs)
Cash-generative operations
Minimal external capital dependency
Unit Economics: Profit or loss per transaction. Revenue per unit minus cost per unit. Positive means each sale generates profit.
FX-Hedged Revenue: Income in hard currency (USD/EUR/GBP) while costs stay in local currency. When local currency depreciates, revenue maintains purchasing power while costs decline in dollar terms.
Direct payment enables camel economics at the credit level:
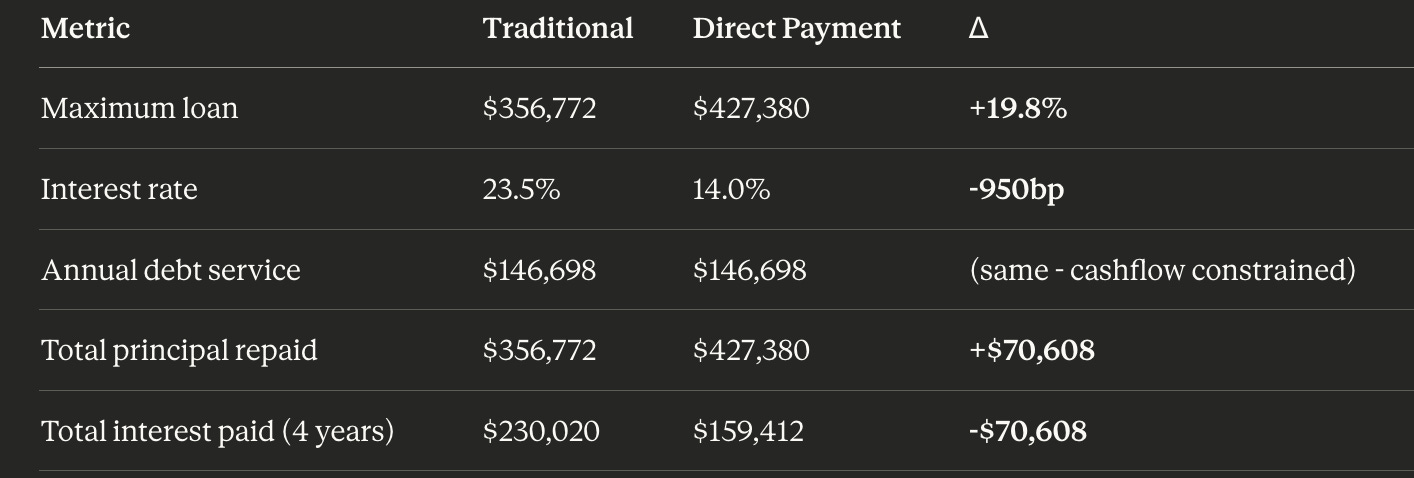
A catalogue financed under direct payment structure pays 37% of total payments to interest versus 61% under traditional structure. This means 63% more of each payment builds equity rather than servicing debt costs.
Structure isn’t financial engineering. It’s survival design for capital-scarce environments.
And this is why knowledge economy development works operationally: knowledge assets can be restructured for capital efficiency. Manufacturing plants cannot—they require upfront capex regardless of payment routing.
M-Pesa didn’t succeed because Kenyans became more creditworthy. It created a payment rail that bypassed banks entirely. Trust in Safaricom replaced trust in institutions.
Design substitutes for institutions. And when design delivers better outcomes—lower risk, lower cost, faster execution—it doesn’t just compete with institutions. It obsoletes them.
The Market
How Big Is This?
African music catalogues generate ~$800M+ in annual streaming revenue. At 8-12× revenue multiples (standard for IP with 15-20 year cashflow tails), that’s $6-10B in catalogue value.
But most of it isn’t financeable yet. Weak documentation, unclear title, fragmented revenue streams. The addressable market—catalogues with clean title, verifiable revenue, platform concentration—is smaller:
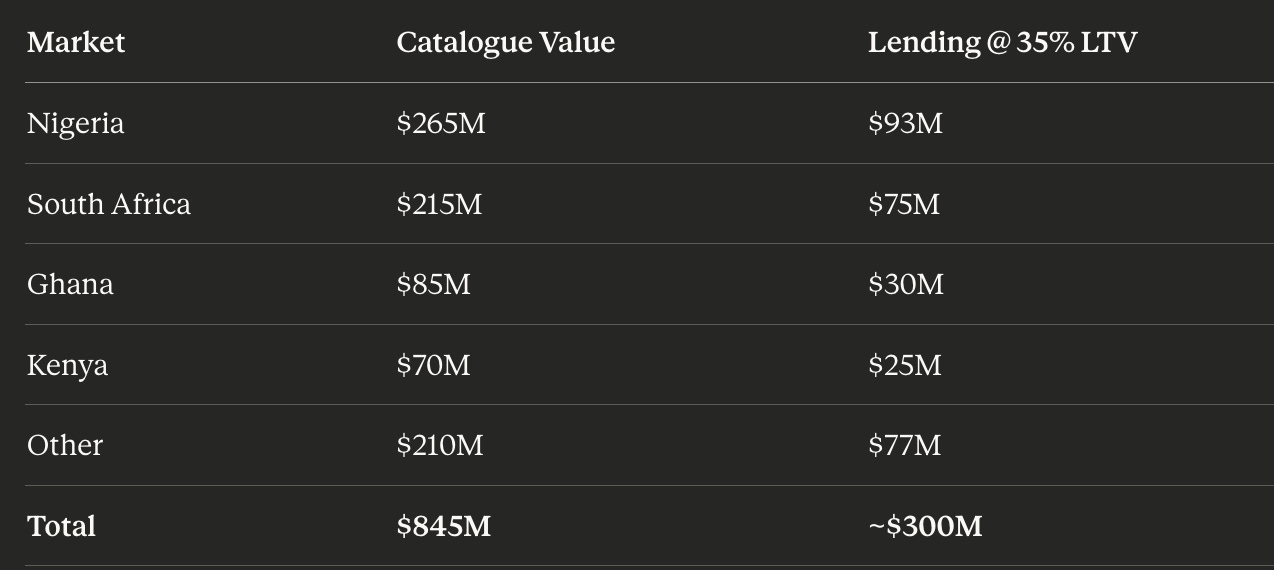
Why 35% LTV? This is the blended average across quality tiers. High-quality catalogues (clean title, 80%+ platform revenue, established artists) support 50% LTV. Marginal catalogues (unclear splits, fragmented revenue) support 25% LTV. The market average settles around 35%.
Current deployed capital: $5-8M (labels offering advances, occasional one-off deals)
Market penetration: 2-3%
Untapped: $290-295M
Why It’s Open
Traditional banks are absent. They lack credit models, platform relationships, and IP expertise.
Fintechs have emerged but with limited capital. They’re originating $200-500k deals but can’t scale without institutional funding.
International IP funds (Hipgnosis, Round Hill) have $5M+ minimums and negligible African focus.
No player has combined: (1) institutional capital, (2) local market knowledge, (3) platform relationships, (4) credit infrastructure.
The Returns
For a bank originating a $427k loan under this model:
Per $427,380 loan:

Net interest margin (6.5%):            $27,780
Expected losses (0.75%):               -$3,205
Operating costs (1%):                  -$4,274
Fee income (Year 1, 2.5%):             $10,685
───────────────────────────────────────────────
Year 1 net revenue:                    $30,986
Allocated capital (10.5%):             $44,875
Return on capital:                     69.1%

Years 2+ (no fee income):              45.2%
ROAC (Return on Allocated Capital): Net revenue divided by regulatory capital required. Banks must hold ~10.5% of each loan as capital buffer under Basel III. A 45.2% ROAC means earning $45.20 for every $100 of capital tied up.
Typical banking ROAC: 12-18%
This is 3× normal returns.
Why? Because the market misprices the asset. Banks see “exotic IP collateral” and apply distressed asset discounts. Direct payment converts it to “platform receivables” but the market hasn’t caught up yet.
That mispricing window closes once:
Competition arrives (margins compress 200-400bp)
Regulatory treatment improves (capital efficiency doubles if risk weights drop from 100% to 50%)
Institutional capital enters (large funds demand lower returns)
Timeline: 2026-2029.
The Meta-Thesis
This essay completes a six-part argument:
1. Asset-Level Insight (Music IP as Collateral)→ African catalogues are underpriced because valuation models ignore durability
2. Asset Class Positioning (Music Publishing is Real Estate)→ Music IP should be financed like income real estate: stable cashflows, long duration, collateral-backed
3. Credit Implementation (This essay)→ Direct payment makes IP bankable by eliminating trust gaps
4. Systemic Capital Design (Financial Architecture for Knowledge Economies)→ Knowledge economies need different credit systems than industrial economies
5. Development Model (Africa Knowledge Economy Development)→ African economies should monetize knowledge/cultural IP before traditional industrialization
6. Strategic Doctrine (The Camel Imperative)→ Capital-efficient, FX-resilient models work better in frontier markets
The Through-Line
African economies can spur industrialization investment by monetizing knowledge assets—but this requires building financial mechanisms that make intangible assets bankable in low-trust environments.
What makes this operational rather than aspirational:
The assets exist: Music catalogues generating $800M+ annual revenue
The valuations hold: 8-12× revenue multiples are defensible for 15-20 year cashflow streams
The credit systems work: 8-10 weeks to deploy, $50-100k setup cost, 40-70% ROAC
The capital efficiency aligns with camel doctrine: 14% cost of capital vs. 20%+ for traditional structure
This isn’t theory. It’s a working model. Banks can copy this.
What Should Happen Next
Two scenarios:
Scenario A: African Institutions Capture
Nigerian/South African/Kenyan banks move in 2026-2027. They:
Build platform relationships with Spotify/Apple/YouTube
Originate 8-12 pilot deals to prove the model
Share performance data with regulators (CBN, SARB)
Shape industry standards before they ossify
Scale to $20-30M portfolios by 2028-2029
By 2030: African banks dominate the asset class. They’ve built operational moats (platform relationships, regulatory credibility, 5-year track records). International capital arrives but pays licensing fees or accepts minority participations.
Value capture: ~70% to African institutions
Scenario B: International Capital Extracts
African banks hesitate. International IP funds enter in 2027-2028 with:
Established platform relationships from US/UK markets
Institutional credibility with Spotify/Apple
Cheaper capital (8-10% cost of funds vs. African banks’ 12-14%)
By 2030: International funds dominate. African banks provide local origination and servicing but capture only 15-20% economics through fee arrangements.
Value capture: ~70% to international capital
The Window
The difference between these scenarios is who moves in the next 18-24 months.
Platform relationships take 6-12 months to establish. Regulatory credibility takes 2-3 years of clean performance data. Operational expertise requires 15-20 deal cycles.
Start today, and you’re positioned by late 2027.
Start in 2028 and you’re competing with entrenched players.
The blueprint exists. The platforms work. The catalogues perform.
The question is whether African institutions move fast enough—or whether international capital arrives first.
The LUMI Brief Knowledge Economy Series:
📖 Music IP as Collateral — Asset valuation
📖 Music Publishing is Real Estate — Asset class framing
📖 Financial Architecture for Knowledge Economies — Credit system design
📖 Africa Knowledge Economy Development — Development strategy
📖 The Camel Imperative — Capital efficiency doctrine
Olumide (Lumi) Mustapha is a venture strategist and fractional general counsel advising African funds and founders. He writes The LUMI Brief on Substack.
For inquiries on IP credit systems: lumi@lumimustapha.com
Very interesting thesis. I'm curious as to how many Nigerian artists earn enough money from streaming to make this a worthwhile endeavour for Nigeriaan commercial banks. I reckon that we upcoming finance players would have more flexibility to execute on something like this, but I don't know about whether our balance sheet can carry this, or whether the main streaming players, Spotify, Apple and YT Music would even be interested.
Nonetheless, it would be great for a few players to take this up. Even if just for experimental purposes. Thank you for sharing this.